Civmec – poised for a potential breakout above flag formation! (10 Sep 23)

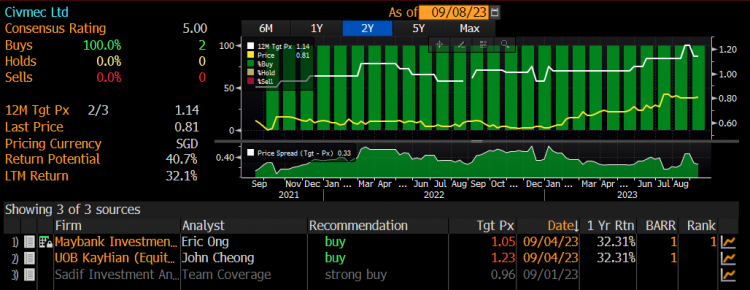
Dear all With reference to my technical write-up on Boustead Singapore dated 23 Jun (click HERE), I pointed out that Boustead Singapore seems to be poised for a bullish breakout. It closed at $0.825 on 23 Jun and subsequently jumped 9% to touch an intraday high of $0.900 on 26 Jul. This compares favourably to STI which generated a 4.0% over the same period. Another stock, Civmec has recently caught my attention due to its chart development which may portend a potential bullish breakout. It closed $0.805 on 8 Sep. First of all, let’s understand what Civmec does.   Description […]
Nov has been a fantastic month for equities! What’s next? (3 Dec 22)

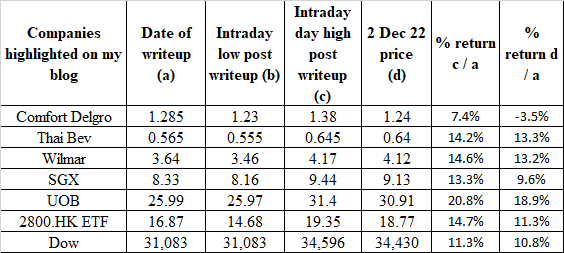
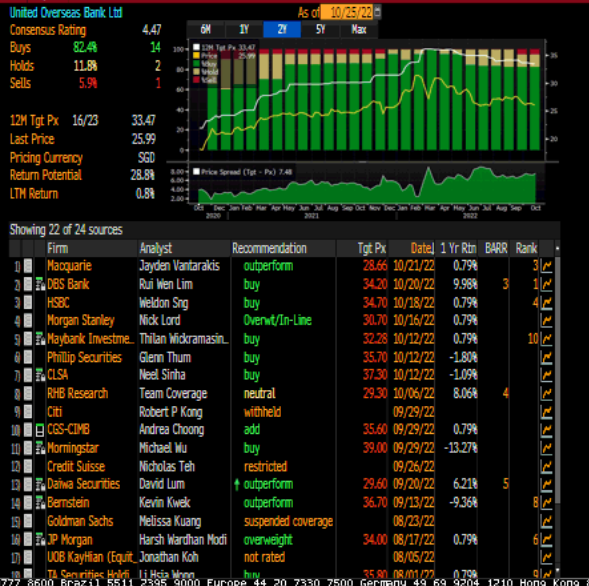
Dear all With reference to my writeup published on 25 Oct (click HERE), where markets seem to be plagued with various negative news, I pointed out that Dow may have formed a bullish double bottom formation. In the writeup, I also featured Hang Seng tracker ETF (2800.HK) and UOB. My clients would have noticed my almost daily writeups on the stocks to consider taking a closer look as they hit lows in Oct. Below are only some of the stocks which I have featured on my blog in Oct and their performance. Table 1: Featured writeups on my blog in […]

Dow seems to have formed a bullish double bottom formation (25 Oct 2022)

Dear all Talk to anyone and I guess at least 50% of them are shaking their heads. Some of their usual concerns are a) Anxieties on the economy and their jobs in 2023; b) Hit by inflationary pressures from rising costs ranging from food, fuel, electricity, cars and properties; c) Worries over their home mortgage as rates are soaring through the roof; d) Concerns on their portfolios whether there may be more losses ahead and etc… At the point of writing this article, Hang Seng closed -1,030 points lower, or -6.4% to close 15,181. Is it all doom and gloom? […]

Alert! Comfort Delgro – Multi-month base building & challenges key resistance – Looks bullish (6 Aug 22)

Dear Readers, As you are aware, I usually will do a stock screening using Bloomberg at the start of each month. In the screening, Comfort Delgro (“CD”) pops out on attractive valuations via my metrics. This is not the first time that CD pops out in my screening. However, coupled with some of the points below, it may arguably be a good time to take a closer look in CD. Due to time constraints, this write-up will be brief and I will just raise some pertinent points and risks. For a more complete picture, it is advisable to refer to […]

3 interesting charts to take note: GSS Energy, China Sunsine and Sing Medical (28 Oct 2021)

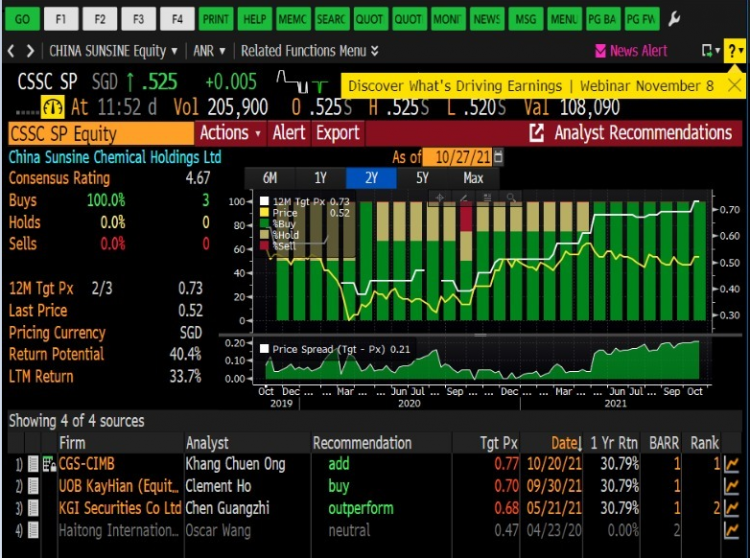
Dear all With reference to my market outlook published on 3 Oct 2021 (see HERE) where I cited opportunities in our Singapore market, our Singapore market (represented by STI) has jumped 154 points, or 5.1% since 1 Oct. Amid the recent strength, is it too late to plough into the markets? Are there still stocks who may have further upside? Based on my personal chart observation, GSS Energy, China Sunsine and Sing Medical have interesting / bullish charts’ setups which may be interesting to take a look.   GSS Energy Based on Chart 1 below, GSS seems to be on […]

STI – to head towards 3,390 points in 1Q2020? (25 Dec 19)

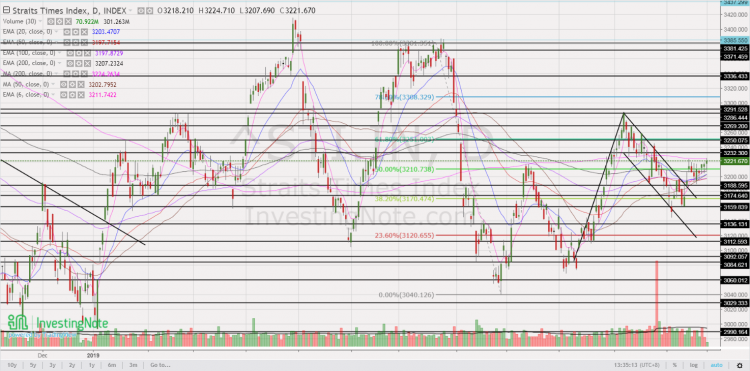
Merry Xmas! As we approach end 2019, most market strategists are putting their market estimates for end 2020. Although I do not profess to be in the league of these market strategists, just for fun, I am expecting STI to head towards 3,390 in 1Q2020. STI closed at 3,222 on 24 Dec 2019. I have outlined my basis and the risks involved.   Factors for my bullish basis a) Chart looks positive after bullish break Based on Chart 1 below, STI has staged a bullish break above its flag formation on 12 Dec 2019. Notwithstanding below average volume for the […]

Chasen – a bullish double bottom making in the making? (23 Oct 19)

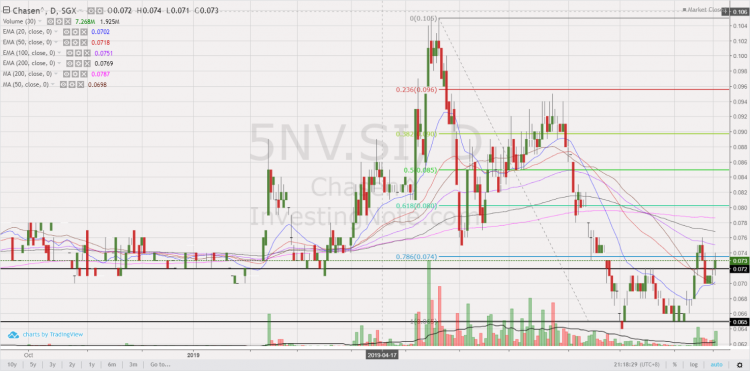
Dear all, This week, Chasen catches my attention as it seems to be forming a bullish double bottom on its chart. I have appended my personal chart analysis, together with some potential positive and negative points on the company. Read on for more below.   Chasen’s chart analysis Based on my personal interpretation of Chasen’s chart, it seems to have tested its double bottom neckline around $0.070-0.072 for the past few days. For the past two days, it managed to close higher consecutively with above average volume. In fact, Chasen closed today with 7.3m shares changing hands, 3.8x above its […]

Nasdaq – potential bearish head and shoulders formation in the making? (29 Sep 19)

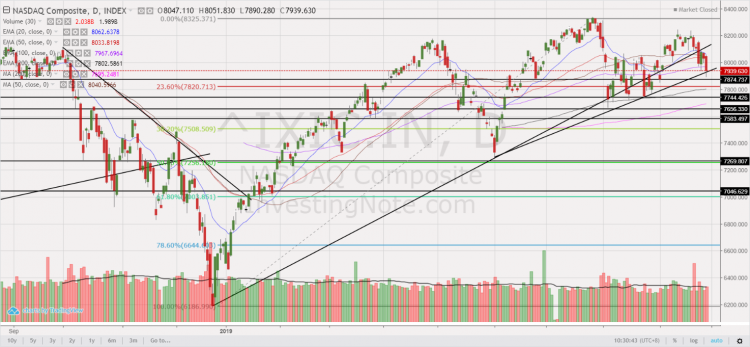
With reference to my earlier write-up (click HERE) titled “S&P500 at 2,979 – limited potential upside (8 Sep 19)”, S&P500 touched intraday highs of 3,021 – 3,022 on 12 Sep 2019 and 19 Sep 2019 but it was still lower than the record intraday high of 3,028 on 26 July 2019. S&P500 closed at 2,962 on 27 Sep 2019. Hang Seng and STI touch one-month intraday highs on 13 Sep 2019 before profit taking sets in. October is likely a volatile month ahead given (just to cite a few examples) more news on trade talks (e.g. U.S vs China; U.S. […]

ISOTeam – on the verge of a bullish break from a potential double bottom formation! (21 May 2019)

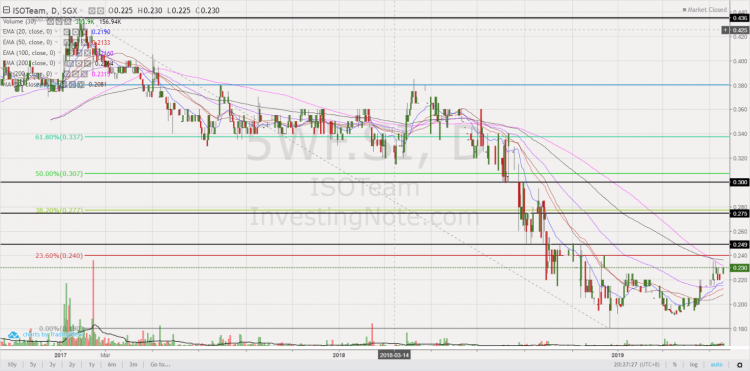
Previously, I have done a write-up (click HERE) on ISOTeam (“ISO”) after interviewing Anthony, CEO and Richard, GM on an exclusive basis in Dec 2018. I have bought in at that time and have taken profit in Jan 2019. Since Apr, I have been accumulating ISO, as its chart seems to portend a potential upside breakout after a lengthy potential double bottom formation. ISO closed at $0.230 on 21 May 2019. Let’s take a look at its investment merits and more importantly, its investment risks below.   Investment merits a) Potential bullish break from a double bottom formation Since 2017, […]

GSS Energy potential inverse head and shoulder formation (13 Sep 17)

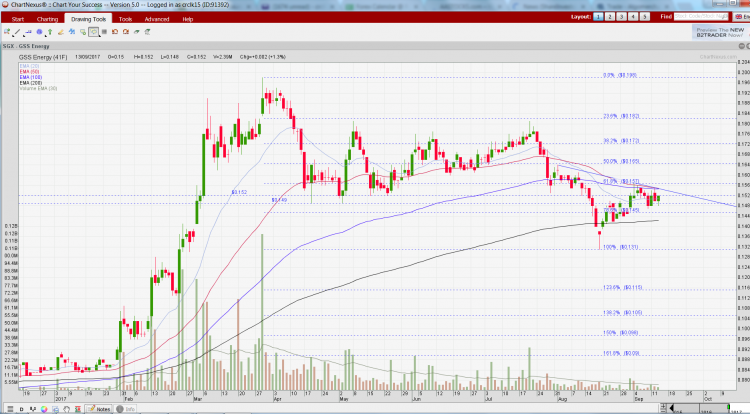
Since my write-up on GSS Energy (“GSS”) dated 18 Aug 2017 (see HERE), GSS’ share price has jumped 12% from $0.137 on 18 Aug 2017 to close at $0.152 on 13 Sep 2017. Based on my personal chart observation, it seems likely to be in the midst of forming a potential bullish inverse head and shoulder formation.   Chart outlook GSS has reclaimed its 200D exponential moving averages (“EMA”) within three trading days after breaching. It has subsequently moved back to its lower trading range of around $0.152. Based on Chart 1 below, there are certain noteworthy points. a) Potential […]