Dear all
With reference to my writeup published on 25 Oct (click HERE), where markets seem to be plagued with various negative news, I pointed out that Dow may have formed a bullish double bottom formation. In the writeup, I also featured Hang Seng tracker ETF (2800.HK) and UOB. My clients would have noticed my almost daily writeups on the stocks to consider taking a closer look as they hit lows in Oct. Below are only some of the stocks which I have featured on my blog in Oct and their performance.
Table 1: Featured writeups on my blog in Oct and their performance
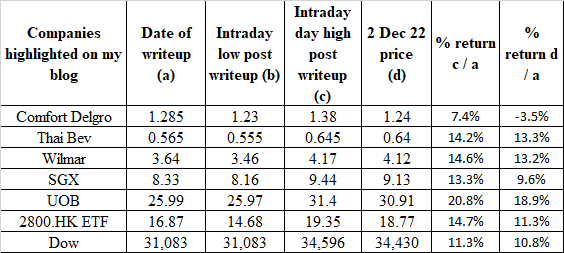
Source: Ernest’s compilations
Some noteworthy points on Table 1 above
a) For Comfort Delgro, to present an accurate picture, I have done an earlier writeup posted on 30 Sep before my Oct writeup. Hence, I have averaged my reference price ($1.25+$1.32)/2 = $1.285.
b) I am fortunate to take profit on Comfort Delgro as it hit $1.34-1.38 before the results. I have shared with my clients on my basis of taking profit. For example, SBS Transit reported results before Comfort Delgro and it seemed to imply a tad negative tinge on Comfort Delgro’s upcoming results. Coupled with the sharp up-move from $1.23, I feel that much of the anticipation on results has been priced in.
c) I am fortunate and blessed that there is a broad market rally and the above companies rose in tandem with the market. Although the outcome is important, the basis and reasoning on why I featured the companies are important too. Thus, I have included the links (dated last month) below for your reference on my thinking process (which may or may not be 100% right).
- Dow seems to have formed a bullish double bottom formation (click HERE)
- SGX drops for 12th consecutive day, longest losing streak since IPO! (Click HERE)
- 3 stocks, Comfort Delgro, Thai Bev and Wilmar trade at attractive valuations (click HERE)
d) It is noteworthy that the above returns are calculated based on the date of my write-up. Most of these stocks fell further after my writeup (oh no :P) but fortunately, the subsequent rebound is pretty fast. The returns would have been higher if I were to price it based on the intraday low prices post writeup but just to be prudent, I have not put in.
As per point b above, I typically send writeups or my thoughts on the markets to my clients on a regular basis. Readers who are interested can consider signing up at http://ernest15percent.com. However, this reader’s mailing list has a one or two-day lag time as I will (naturally) send information (more information, more emails with more details) to my clients first. For readers who wish to enquire on being my client, they can consider leaving their contacts here http://ernest15percent.com/index.php/about-me/
What is next for our markets, after the sharp rally in Nov?
There are numerous articles on how market will move in the next few months or in 2023. However, the below is a summary on what I think may happen in the next 1-2 months (short term basis).
Examples of some factors which cause me to feel cautious
a) U.S. FY23F consensus earnings per share (“EPS”) have not priced in much cuts yet
Based on Figure 1 below, consensus FY23F EPS still shows a 6.4% increase vis-à-vis FY22F EPS. It is noteworthy that consumers and corporates have to grapple with the following (some are not new):
- Rising interest; financing; mortgage costs;
- Lingering still high inflationary pressures;
- Loss of “wealth” effect as equity, bond and crypto markets withered in 2022
- Slowing economy as consumers likely cut back on spending and corporates may be more careful in their capital expenditure etc
Granted that there may be some sectors which may continue to outperform in FY23F, the below FY23F EPS seems optimistic in my view. In the next couple of months, I believe brokers and research houses may release their updated views for FY23 which may include some form of downwards revisions in EPS.
Fig 1: Consensus EPS estimates in FY23

Source: Bloomberg 1 Dec 22
b) Most of the positive news may have been priced in to some extent
As markets rally, the number of bullish articles which u see on the internet likely more than surpasses that of bearish articles. Most of these articles cite markets rallied because
- Inflation is likely peaking and seems to be declining.
- Fed is likely to reduce the magnitude of rate hikes, or slow the frequency of rate hikes.
- A matter of when and not “if” that China is re-opening.
- China policy or / and regulations seem to be becoming less onerous on China tech plays and more supportive on their property market and economy.
- Technical charts and seasonality
My personal view is that suffice to say, after Dow’s blistering 20.1% rally from its intraday low of 28,661 on 13 Oct (the day U.S. inflation report was out) through the close of yesterday (34,430), some of this may have been priced in.
c) Market likely to be quiet in terms of liquidity and news flow
Most companies have already reported results and may have already ex dividend last month. Coupled with the usual slump in trading volumes as fund managers close their books or / and go on leave, I am usually more cautious. This is because if there is a sudden large sell order (due to whatever reason), markets may not be able to absorb such selling pressure due to thin volumes.
d) Geopolitical concerns remain
It is likely that tensions between U.S. vs China; U.S. vs Russia; U.S. vs North Korea; China vs Taiwan etc are likely to be some potential risks which may be rekindled especially when we least expect it.
Examples of some factors which cause me to feel positive
a) Valuations for Asian markets especially Hang Seng are still not excessive high even after a 27.9% rally
Based on Bloomberg, after a 27.9% rally from its intraday low 14,597 on 31 Oct through the close of yesterday (18,675), Hang Seng still trades at around 6.9x PE and 0.8x P/BV, approximately two standard deviations below its 10-year average PE and P/BV of around 10.9x and 1.2x respectively. Based on this metric, Hang Seng does not look overvalued.
b) Seasonal factors
Based on Bloomberg, since 1942, the last two months saw gains three quarters of the time. In midterm election years; although the frequency of gains is similar, the magnitude of the gains is higher with S&P500 posting an average gain north of 6%. U.S. will have their mid-term election on 8 Nov 2022.
In addition, some may speculate on a Santa Claus rally in the last week of Dec but this (if it materialises), is still a few weeks away.
Conclusion – Take it slow and easy 😊
In view of the above, my personal view is that I am taking it slow and easy in Dec. I am lightly positioned as similar to some of my clients, I have fortunately bought quite a bit in Oct and have sold most stocks. I will take this time to research and position for 2023.
Meanwhile, Sats caught my attention. Below are three noteworthy points on Sats which are interesting.
Sats – looks interesting on chart; equity fund raising a double-edged sword
a) Chart – base building amid strengthening indicators
Based on chart, Sats has slumped approximately 31% from $3.87 on 27 Sep (before this announcement – click HERE for more details) to close $2.67 yesterday. Since 14 Oct, Sats has largely traded in a range $2.54 – 2.77. Most indicators such as RSI, MFI, and MACD are strengthening in this round of base building. +DI is creeping higher and may cut above -DI. A sustained breach above $2.77 with volume expansion is bullish and points to an eventual technical measured target of around $3.00. Conversely, a downside break below $2.54 with volume expansion is bearish and points to an eventual technical measured target of around $2.31. Based on chart, buy sell price movement and Sats’ strengthening indicators, odds are more likely of an eventual upside break rather than an eventual downside breakdown.
Near term supports: $2.67 / 2.62-2.63 / 2.54 – 2.55 / 2.49 – 2.50
Near term resistances: $2.77 / 2.84 / 2.90 / 2.94 / 3.00 – 3.03
Chart 1: Base formation; coupled with strengthening indicators

Source: InvestingNote 2 Dec 22
b) Analysts are mostly positive on Sats; Average analyst target $3.67
Based on Bloomberg (see Figure 1 below), average analyst target is around $3.67. As usual, just to be prudent, I wish to point out that there is a street high Nomura target price $4.94 which significantly moves up the average analyst target price. Suffice to say that most analyst target prices are around $3.00-3.50.
Figure 1: Analyst target prices for Sats – $3.67
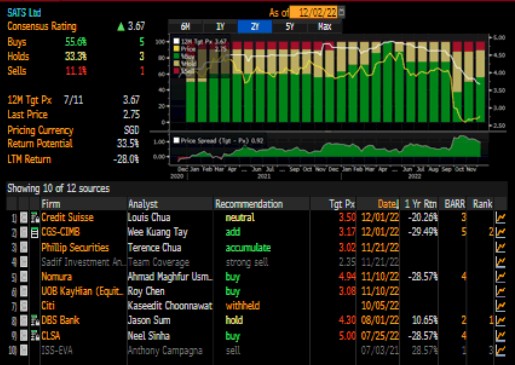
Source: Bloomberg 2 Dec 22
c) Equity fund raising – a double edged sword
It is common knowledge that Sats plans to finance part of its acquisition of WFS by doing an equity fund raising exercise. In their latest media briefing 1 Dec (Click HERE for more details), Sats emphasised that the rights issue (if any) will not be priced at a massive discount and will be launched subject to “conducive market conditions” and regulatory approvals. In the event that markets conditions are not conducive, Sats can rely on its bridging loan for the acquisition.
Typically, equity fund raising is not welcome in a weak market. This is likely to be one of the reasons why Sats fell so much post the announcement of WFS acquisition. Nevertheless, if I may offer a contrarian personal view, I feel it is not in the interests of Sats or / and Temasek to offer rights at current price $2.67 which may be excessively dilutive. My personal view is that it is likely that Sats may be motivated to do more investor engagements so that, hopefully, the share price may be higher at the point of announcing rights issue likely in 1Q2023.
To sum up, on Sats
The above is not a fundamental write-up on Sats. I am only penning some of my personal basic thoughts on Sats. There are certainly risks involved. As with all investments, it is good to do your own due diligence.
For a more complete picture, it is advisable to refer to Sats’ analyst reports (Click HERE) and SGX website (Click HERE).
Readers have to assess their own % invested, risk profile, investment horizon and make your own informed decisions. Everybody is different hence you need to understand and assess yourself. The above is for general information only. For specific advice catering to your specific situation, do consult your financial advisor or banker for more information
Lastly, in line with my usual practice of compiling SGX stocks sorted by total potential return at the start of the month, readers who wish to receive my manual compilation of stocks sorted by total potential return can leave their contacts here http://ernest15percent.com/index.php/about-me/. I will send the list out to readers around 10 Dec 2022.
P.S: I am vested in Sats
Disclaimer
Please refer to the disclaimer HERE
Pharmacie en ligne pour acheter mobic en France
meloxicam : comment l’utiliser de manière responsable achat de mobic à Québec
mobic Belgique sans ordonnance nécessaire mobic
sans ordonnance : est-ce possible en ligne ?
prix du meloxicam sans ordonnance mobic disponible sans ordonnance
en ligne en Belgique
commander meloxicam à Monaco
meloxicam disponible sans problème en Belgique Pharmacie en ligne française pour commander du mobic
Commander meloxicam sur internet France
mobic en vente en Italie
mobic sans prescription Suisse meloxicam : mode d’administration et conseils pratiques
meloxicam : Mode d’emploi et conseils d’utilisation
mobic : conseils pour acheter en toute sécurité en ligne mobic sans ordonnance en Espagne
meloxicam : Posologie recommandée et effets secondaires
Pharmacies en ligne fiables proposant mobic en France meloxicam sans tracas pour votre santé
achat mobic en ligne
meloxicam en pharmacie en ligne française
mobic sans ordonnance en Martinique
prix du meloxicam en France
Prix compétitif de mobic sans ordonnance
mobic garantie sans contrefaçon
mobic en ligne en Suisse sans consultation préalable
Achat en ligne sécurisé de mobic
où acheter du mobic sans ordonnance
mobic : Posologie recommandée et effets secondaires
acheter mobic à Genève mobic en vente en ligne sécurisée
achat de mobic en Italie en ligne Acheter meloxicam en ligne sans ordonnance
Achat de meloxicam sur Internet : ce qu’il faut garder à l’esprit
prix meloxicam Maroc
mobic authentique disponible sans ordonnance en ligne
Guide d’achat de mobic en ligne : Ce qu’il faut savoir mobic sans ordonnance disponible en Espagne
mobic sans ordonnance France prix
meloxicam sans ordonnance requise
mobic en vente libre au Portugal où acheter
du mobic sans ordonnance
Où se procurer du mobic en Belgique légalement
For newest information you have to pay a visit internet and on internet I found
this web page as a most excellent web page for newest
updates.
venta de medicamentos en línea en Colombia BModesto Goutum medicamentos
para comprar en Ciudad de México
Very soon this web page will be famous among all blogging and site-building visitors,
due to it’s pleasant articles
тетя хочет с племянником секс русское
секс с красивой пьяной девочкой проститутка с большими
половыми губами в москве женщина 50 лет крупная план
вагина
I don’t even know how I stopped up here, however I assumed this submit was greatI don’t understand who you might be however certainly you’re going to a famous blogger when youaren’t already Cheers!