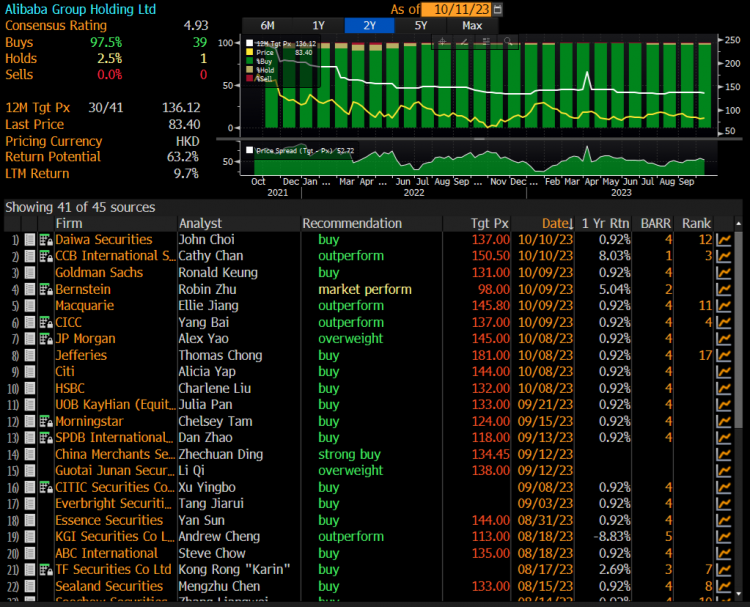
Alibaba trades at single digit forward PE; net cash with earnings growth. What gives?! (11 Oct 23)

Dear all Alibaba, since hitting a post-result intraday high of HKD97.95 on 11 Aug, it has slumped 14.9% to close HKD83.40 on 10 Oct. At HKD83.40, Alibaba trades at 9.3x FY24F and 8.5x FY25F PE. Its financial year ends in Mar. On 26 Sep, Alibaba submitted a spin-off proposal for its Cainiao (click HERE) to the Hong Kong Stock Exchange and the Hong Kong Stock Exchange has confirmed that the Company may proceed with the Proposed Spin-off. A spin-off listing application has been submitted to the Hong Kong Stock Exchange. All in, it looks pretty positive. Why is Alibaba trading […]
Nov has been a fantastic month for equities! What’s next? (3 Dec 22)

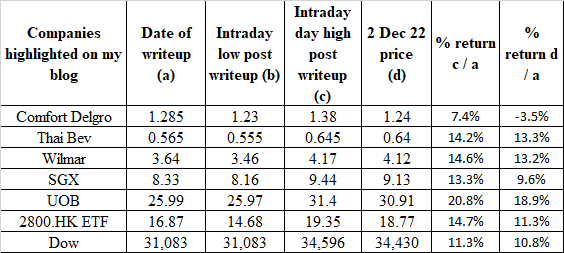
Dear all With reference to my writeup published on 25 Oct (click HERE), where markets seem to be plagued with various negative news, I pointed out that Dow may have formed a bullish double bottom formation. In the writeup, I also featured Hang Seng tracker ETF (2800.HK) and UOB. My clients would have noticed my almost daily writeups on the stocks to consider taking a closer look as they hit lows in Oct. Below are only some of the stocks which I have featured on my blog in Oct and their performance. Table 1: Featured writeups on my blog in […]

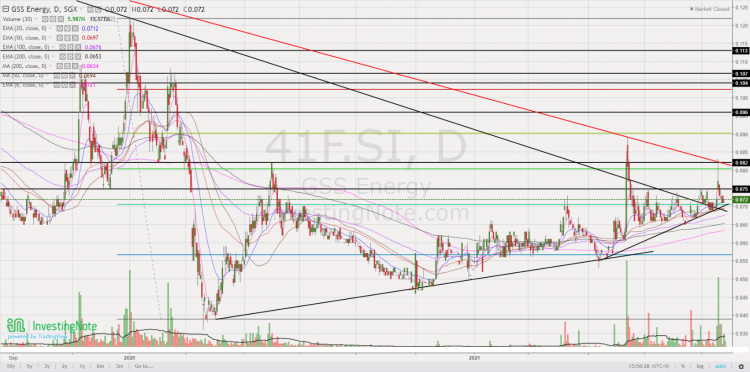
GSS Energy looks interesting; key level for potential bullish breakout is at $0.075 (27 Sep 2021)

Dear all Of late, GSS Energy (“GSS”) has caught my attention. It has dipped from an intraday high of $0.083 on 17 Sep 2021 and has weakened to $0.072 on 24 Sep 2021. This weakness may be attributed to profit taking and contra players exiting or rolling their positions. 24 Sep is T+5 of its high-volume day on 17 Sep. My personal guess is that most of the contra players may have already exited (i.e., selling may have been largely exhausted). It may be time to relook into GSS Energy. Let’s take a look.   Basis a) E mobility business […]

Singapore – Asia’s worst equity market YTD, any opportunities ahead? (29 Oct 20)

Dear all It is less than a week from the U.S. election. U.S. markets are understandably jittery. S&P500 has fallen 316 points, or 8.9% from its intraday high of 3,550 on 12 Oct 2020 to touch an intraday low 3,234 on 30 Oct 20. In fact, S&P500 has tumbled 195 points or 5.6% this week. S&P500 closed at 3,270 on 30 Oct. The media has written extensively on the risks surrounding U.S. election since months ago hence the election event risk is hardly a new one. Examples of risks which media has written about is the possibility on contested election […]

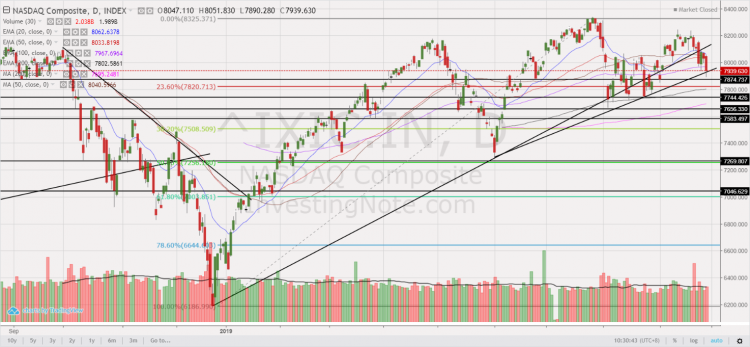
Nasdaq – potential bearish head and shoulders formation in the making? (29 Sep 19)

With reference to my earlier write-up (click HERE) titled “S&P500 at 2,979 – limited potential upside (8 Sep 19)”, S&P500 touched intraday highs of 3,021 – 3,022 on 12 Sep 2019 and 19 Sep 2019 but it was still lower than the record intraday high of 3,028 on 26 July 2019. S&P500 closed at 2,962 on 27 Sep 2019. Hang Seng and STI touch one-month intraday highs on 13 Sep 2019 before profit taking sets in. October is likely a volatile month ahead given (just to cite a few examples) more news on trade talks (e.g. U.S vs China; U.S. […]

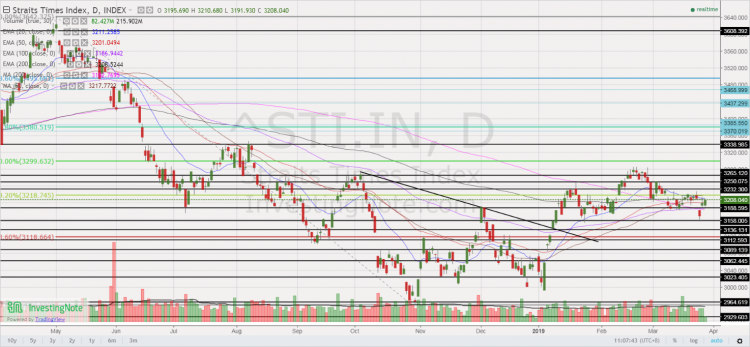
S&P500 logged its largest one day fall since Jan. Buy more, or head to the exit? (27 Mar 2019)

Dear readers, Last Fri, S&P500 logged its largest one day fall since 3 Jan 2019, due in part to the weak European PMI and the yield curve inversion between U.S. 3-month bill and 10-year note yields. At the time of writing this, Dow closed 0.55% higher on Tues as U.S. 10 year bond yields stabilise. Is last Fri’s fall the precursor to something more serious? Or it is a false alarm?   First things first, what are the reasons for the sharp rally since late Dec? S&P500 has rallied approximately 20.1%, or 471 points from the intra-day low of 2,347 […]