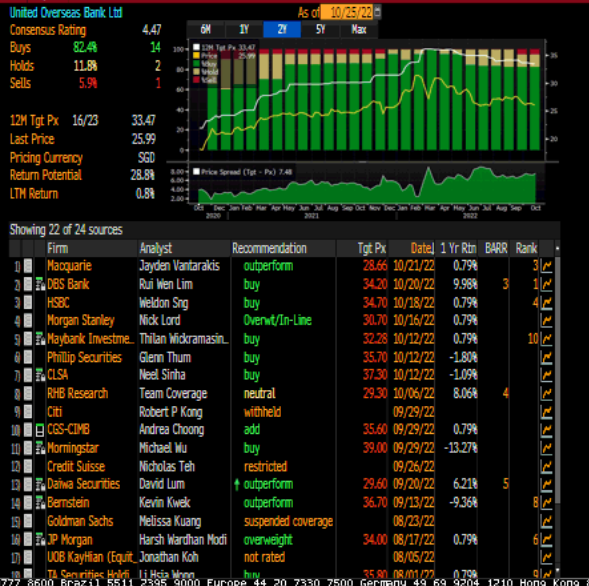
Figure 1_UOB analyst target price 25 Oct 22

Dow seems to have formed a bullish double bottom formation (25 Oct 2022)

Dear all Talk to anyone and I guess at least 50% of them are shaking their heads. Some of their usual concerns are a) Anxieties on the economy and their jobs in 2023; b) Hit by inflationary pressures from rising costs ranging from food, fuel, electricity, cars and properties; c) Worries over their home mortgage as rates are soaring through the roof; d) Concerns on their portfolios whether there may be more losses ahead and etc… At the point of writing this article, Hang Seng closed -1,030 points lower, or -6.4% to close 15,181. Is it all doom and gloom? […]

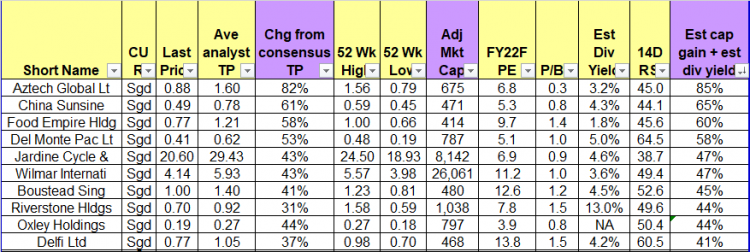
Table 1_Top ten stocks sorted by total potential return 31 Aug 22

Sep – Historically a weak month for equities. Buy, hold or sell? (6 Sep 2022)

Dear all, After touching an intraday high 4,325 on 16 Aug 22, S&P500 has slid 401 points, or -9.3% to 3,924 on 2 Sep. Hang Seng has slid to around 19,144 at the time of writing. Given the market pullback, there are several interesting stocks worthy of research. Coupled with various macro events happening this month (e.g. ECB & Fed Chair Powell Speaks 8 Sep; U.S CPI 13 Sep and FOMC 22 Sep etc.), I have to plan my trading strategy. Give the above, time is tight and this will be just be a brief article to update readers. (As […]

Fig 1_Factory capacity, floor plan to produce electric motorcycle

GSS Energy – Electric mobility business takes shape (25 Jan 22)

Dear all, With reference to my write-up published on 5 Jan 2022 (click HERE) citing that Asian indices are likely to outperform that of the U.S. market in 2022, our Asian indices, viz. Hang Seng and STI have outperformed the U.S. market significantly (See Table 1 below). U.S. S&P500 notched a 6.4% decline whereas Hang Seng and STI registered a 9.0% and 4.2% gain respectively since my write-up. Table 1: S&P500, Hang Seng and STI 2021 performance since 5 Jan 2022 Source: Ernest’s compilation Given the outperformance, are there still pockets of opportunities in our Singapore market? The short answer […]

Table 2_Top ten stocks sorted by total potential return 31 Dec 21

Will Singapore stocks outperform U.S. stocks in 2022? (5 Jan 2022)

Dear all With reference to my market outlook published on 7 Nov (see HERE) citing our Singapore market may face near term profit taking, STI dropped 201 points, or 6.6% from 3,242 on 5 Nov to close at 3,041 on 30 Nov. As we start 2022, various investment banks and research houses have put forth their views on how the various markets will perform. In this write-up, I will share how the markets have performed in 2021 and my market outlook in 2022.   How did the markets perform in 2021? Based on Table 1 below, it is evident that […]

Table 1_Top ten stocks sorted by total potential return 30 Jul 21

S&P500 closed at record high! What should we do? Buy or sell? (9 Aug 2021)

Dear all S&P500 has clocked its sixth consecutive month of gains in July 2021. This is the longest stretch since 2018. Furthermore, S&P500 has touched a record high to close at 4,437 on 6 Aug 2021. In the next 3 months, are markets poised for higher highs? Or should we be prudent and take some profit off the table first? Let’s take a look.   Ernest’s personal market observations a) Lack of catalysts to push the market higher Since Covid last year, markets, especially U.S. markets, have been able to push higher due partly to the combination of ultra-easy monetary policies; […]

STI 1Y chart 24 Dec 19

STI – to head towards 3,390 points in 1Q2020? (25 Dec 19)

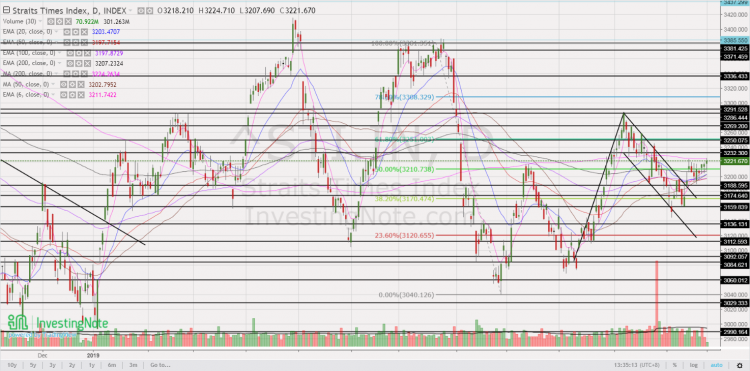
Merry Xmas! As we approach end 2019, most market strategists are putting their market estimates for end 2020. Although I do not profess to be in the league of these market strategists, just for fun, I am expecting STI to head towards 3,390 in 1Q2020. STI closed at 3,222 on 24 Dec 2019. I have outlined my basis and the risks involved.   Factors for my bullish basis a) Chart looks positive after bullish break Based on Chart 1 below, STI has staged a bullish break above its flag formation on 12 Dec 2019. Notwithstanding below average volume for the […]

Table 1_Stock price performance for some tech stocks

Frencken nears 14Y overbought RSI level amid 10Y high prices (19 Nov 2019)

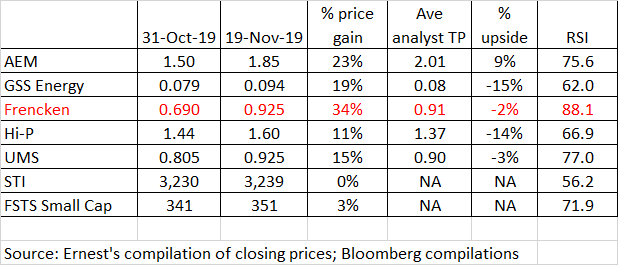
This week, Frencken has caught my attention with its 34% surge from $0.690 on 31 Oct 2019. It closed $0.925 on 19 Nov 2019. At $0.925, this is very near to its 10-year high closing price $0.930 set on 18 Nov 2019. Since 31 Oct 2019, it has risen 10 out of the past 13 trading days with two days having closed unchanged. RSI closed at 88.1 on 19 Nov 2019, which is near a 14 year overbought level. Based on Frencken’s chart, it seems to present a favourable risk to reward short trade. Please see the basis and more […]

Chasen chart 23 Oct 19

Chasen – a bullish double bottom making in the making? (23 Oct 19)

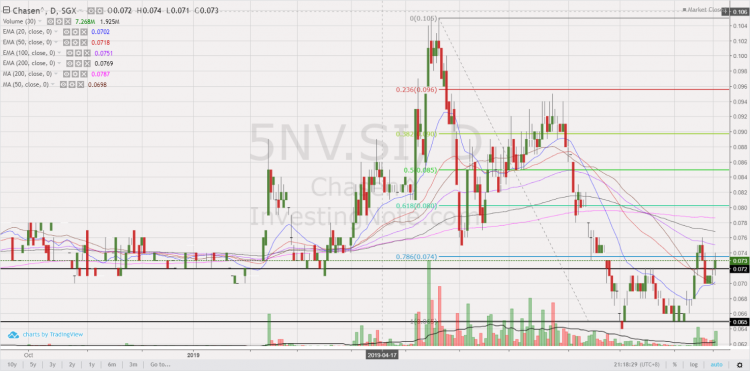
Dear all, This week, Chasen catches my attention as it seems to be forming a bullish double bottom on its chart. I have appended my personal chart analysis, together with some potential positive and negative points on the company. Read on for more below.   Chasen’s chart analysis Based on my personal interpretation of Chasen’s chart, it seems to have tested its double bottom neckline around $0.070-0.072 for the past few days. For the past two days, it managed to close higher consecutively with above average volume. In fact, Chasen closed today with 7.3m shares changing hands, 3.8x above its […]

Chart 3_S&P500 chart 6 Sep 19

S&P500 at 2,979 – limited potential upside (8 Sep 19)

With reference to my earlier write-up (click HERE) titled “Why am I cautious going into July…”, July was coincidentally the peak for S&P500. Hang Seng touched an intraday high of 29,008 on 4 Jul 2019 before slumping 4,108 points to an intraday low of 24,900 on 15 Aug 2019 (Hang Seng closed at 26,691 on 6 Sep 2019.) Personally, given the current market levels and information, I am not comfortable to raise my current percentage invested from 53% to significant levels (say >80%). Why am I cautious in the market? Do read on…   Factors supporting my cautious basis Above […]

Analyst target price 29 Aug 19

HRNet – All time oversold levels amid lowest price since IPO! (29 Aug 19)

Dear all Another exciting week! This week, HRNet caught my attention as it approaches all time oversold RSI level. In addition, it is trading at the lowest price $0.560 since its IPO price at $0.900. Given the basis below, my personal view is that HRNet may be presenting a favourable risk reward setup for a long trade. Do look at the basis and more importantly, the risks inherent in such trades.   My personal basis a) Average target price $0.93! Based on Figure 1 below, average analyst target is around $0.930, representing a potential capital upside 66%. Estimated div yield […]