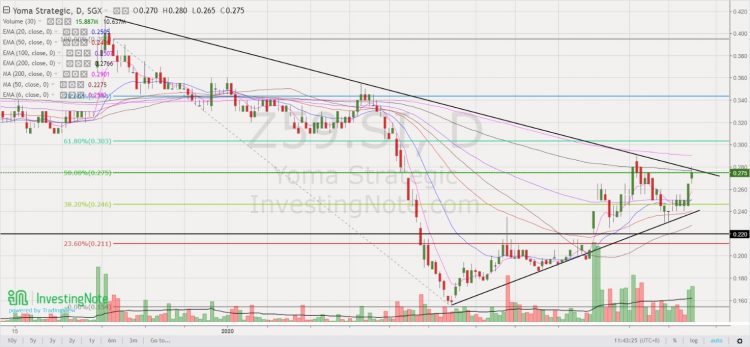
Singapore – Asia’s worst equity market YTD, any opportunities ahead? (29 Oct 20)

Dear all It is less than a week from the U.S. election. U.S. markets are understandably jittery. S&P500 has fallen 316 points, or 8.9% from its intraday high of 3,550 on 12 Oct 2020 to touch an intraday low 3,234 on 30 Oct 20. In fact, S&P500 has tumbled 195 points or 5.6% this week. S&P500 closed at 3,270 on 30 Oct. The media has written extensively on the risks surrounding U.S. election since months ago hence the election event risk is hardly a new one. Examples of risks which media has written about is the possibility on contested election […]

Recent weakness provides accumulation opportunities (9 Sep 20)

Dear all Based on Table 1 below, U.S. indices have fallen between 5.5% – 10% from the close of 2 Sep to 8 Sep. Nasdaq led the decline with a 10% drop. These are interesting times indeed! Why do I say so? Read on below. Table 1: Performance of various indices from 2 Sep to *8 Sep 20 Source: Ernest’s compilations (*STI and Hang Seng are based on 9 Sep closing prices) In my personal opinion, this recent U.S. market weakness provides accumulation opportunities for the well prepared and for those who have been waiting on the side-lines to accumulate […]

Stocks sorted by total potential return (7 Sep 2020)

Dear all U.S. markets have fallen sharply with Nasdaq dropping almost 1,200 points or 10% from an intraday high of 12,074 on 2 Sep to an intraday low of 10,876 last Fri. For example, Apple Inc. has lost $219b in market cap from the close of 1 Sep through 3 Sep which is larger than the market cap of Exxon Mobil Corp., for long the world’s largest company! In view of the recent decline, some clients have asked me which are the stocks that they can look at. Below is my compilation of the top ten stocks and the bottom […]

Chart alert! Yoma may breach $0.280 in the near term (23 Jun 2020)

This week, Yoma catches my attention on a spike in share price, accompanied with an expansion in volume. Let’s take a look.   Chart analysis Yoma’s chart has been on a short-term uptrend since 24 Mar. ADX last trades 22.2, amid positively placed Dis, indicative of a trend. Its short term exponential moving averages (“EMA”) are rising steadily and its long term moving averages (namely 200D EMA and 200D SMA) are plateauing. Indicators such as OBV and RSI are strengthening. Volume has picked up significantly today and yesterday which may signify good odds of breaching its key resistance $0.275 – […]

STI – to head towards 3,390 points in 1Q2020? (25 Dec 19)

Merry Xmas! As we approach end 2019, most market strategists are putting their market estimates for end 2020. Although I do not profess to be in the league of these market strategists, just for fun, I am expecting STI to head towards 3,390 in 1Q2020. STI closed at 3,222 on 24 Dec 2019. I have outlined my basis and the risks involved.   Factors for my bullish basis a) Chart looks positive after bullish break Based on Chart 1 below, STI has staged a bullish break above its flag formation on 12 Dec 2019. Notwithstanding below average volume for the […]

Why am i cautious going into July… (2 Jul 19)

Dear all, With reference to my market write-up published on 29 May 2019 (click HERE), where I mentioned that the sell-off in the markets revealed interesting trading opportunities, markets coincidentally bottomed on 3 Jun 2019 and staged a strong recovery. I have already sold into strength and reduced my percentage invested in stocks from 150% in early June to 12% now. Personally, I am cautious in the market going into July. Why is this so?   Basis below 1) Markets jumped yesterday following the U.S. / China trade truce announced over the weekend, despite the lack of details on what […]

Hang Seng & STI have fallen close to 2,900 & 250 points in one month! (28 May 19)

Dear readers, Asian markets have fallen quite a bit in the past one month. For example, Hang Seng has fallen close to 2,900 points since touching a high of 30,280 on 15 Apr to trade 27,391 which is the low last seen in January. STI has fallen almost 250 points from an intraday high of 3,415 on 29 Apr to close 3,165 today. Looking at the indices may be deceiving as many shares have fallen a lot. For example, based on Table 1 below, most stocks have fallen at least 10%, with Sembmarine tumbling almost 17% in less than a […]

S&P500 logged its largest one day fall since Jan. Buy more, or head to the exit? (27 Mar 2019)

Dear readers, Last Fri, S&P500 logged its largest one day fall since 3 Jan 2019, due in part to the weak European PMI and the yield curve inversion between U.S. 3-month bill and 10-year note yields. At the time of writing this, Dow closed 0.55% higher on Tues as U.S. 10 year bond yields stabilise. Is last Fri’s fall the precursor to something more serious? Or it is a false alarm?   First things first, what are the reasons for the sharp rally since late Dec? S&P500 has rallied approximately 20.1%, or 471 points from the intra-day low of 2,347 […]