Markets hit by selling pressure. Is it time to BUY? (23 Oct 23)

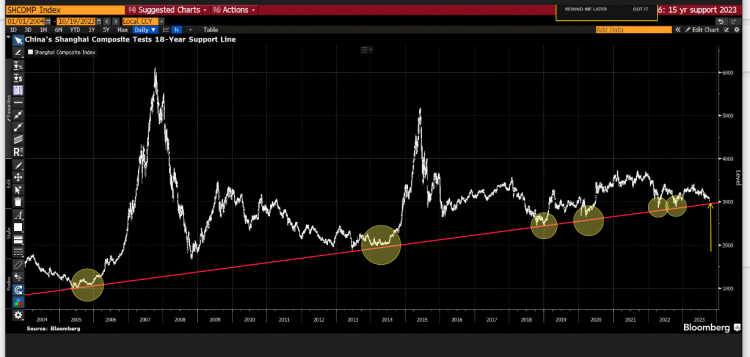
Dear all It has been some time since I last wrote an article on market outlook. I have been extremely busy for the past three months where I have been meeting companies and other associates. (Check out my LinkedIn HERE). I have also just arranged an exclusive meetup with Lendlease Reit Manager CEO, Kelvin Chow and Head of Investor Relations, Ling Bee Lin with my clients last Friday. (Click HERE). As of last Friday, Lendlease Reit’s market capitalisation is around S$1.16b. With reference to Chart 1 below, October continues to see the third monthly outflows of funds from China equity markets. […]
Boustead Singapore – chart poised for a bullish breakout! (23 Jun 23)

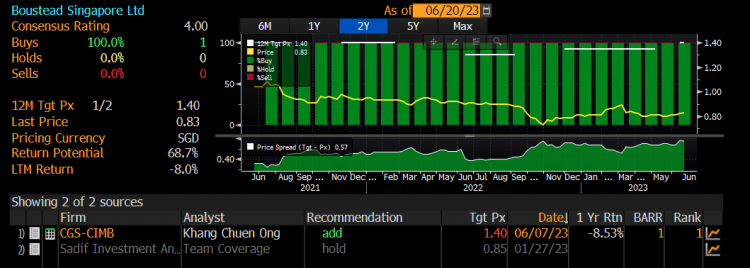
Dear all With reference to my write-up on Comfort Delgro dated 9 Jun 2023 (click HERE) where I pointed out that I am comfortable to accumulate Comfort Delgro for a trading play, Comfort Delgro closed at $1.03 on 9 Jun, the lowest close last since on 18 Mar 2004. Since my writeup, Comfort Delgro has fortunately appreciated nine out of ten trading days to close almost 15% higher at $1.18 today. This compares favourably with STI which moved up 0.2% over the same period. Another stock, Boustead Singapore has recently caught my attention due to its chart development. It closed […]

Keppel Corp slumps 7% post results to $7.11 – Any trading opportunity ahead? (8 Feb 23)

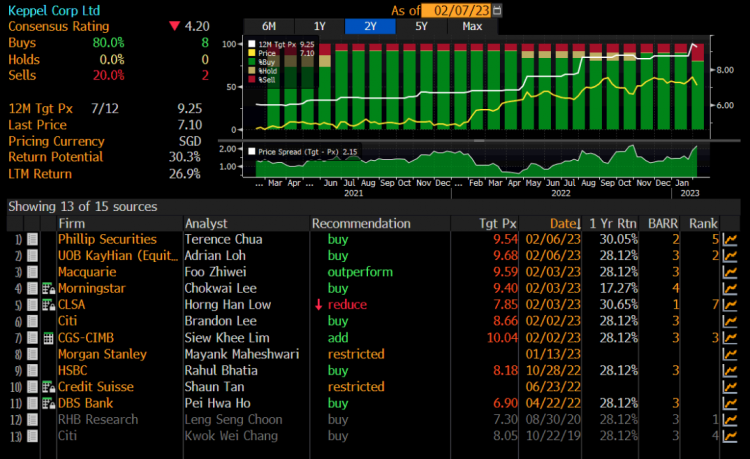
Dear all, Kep Corp has fallen $0.54 or 7% from $7.65 on 2 Feb to close $7.11 yesterday. In this write-up, I will elaborate on my take on what has happened and whether there is any trading opportunity.   Why did Kep Corp plummet 7%? Kep Corp announced 4QFY22 results on 2 Feb after market. Based on CGS-CIMB report, Kep Corp’s FY22 net profit of S$927m slightly beat estimates, at 102% consensus estimates. So what has caused the sharp drop in share price post results? My guess is that Kep Corp probably drops because a) Kep Corp has appreciated 7.6% […]

Nov has been a fantastic month for equities! What’s next? (3 Dec 22)

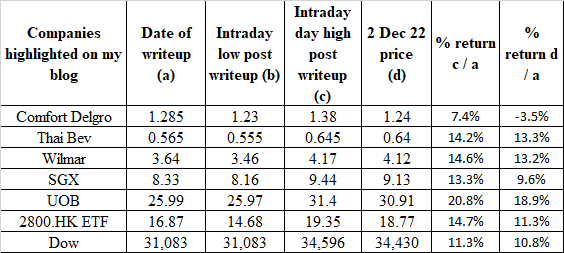
Dear all With reference to my writeup published on 25 Oct (click HERE), where markets seem to be plagued with various negative news, I pointed out that Dow may have formed a bullish double bottom formation. In the writeup, I also featured Hang Seng tracker ETF (2800.HK) and UOB. My clients would have noticed my almost daily writeups on the stocks to consider taking a closer look as they hit lows in Oct. Below are only some of the stocks which I have featured on my blog in Oct and their performance. Table 1: Featured writeups on my blog in […]

Dow seems to have formed a bullish double bottom formation (25 Oct 2022)

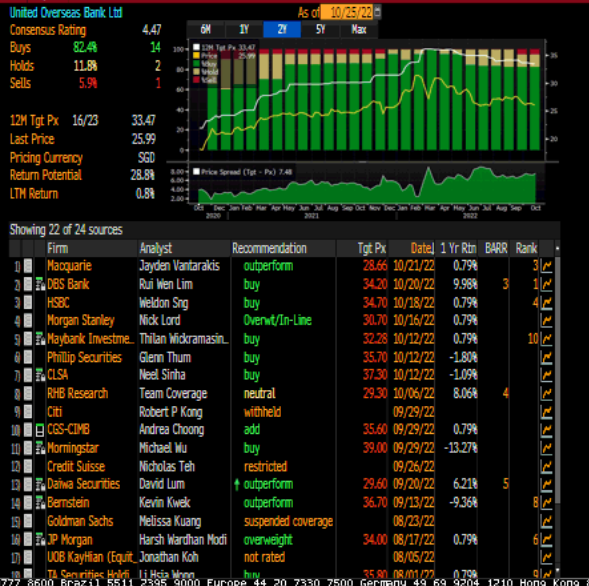
Dear all Talk to anyone and I guess at least 50% of them are shaking their heads. Some of their usual concerns are a) Anxieties on the economy and their jobs in 2023; b) Hit by inflationary pressures from rising costs ranging from food, fuel, electricity, cars and properties; c) Worries over their home mortgage as rates are soaring through the roof; d) Concerns on their portfolios whether there may be more losses ahead and etc… At the point of writing this article, Hang Seng closed -1,030 points lower, or -6.4% to close 15,181. Is it all doom and gloom? […]

Yangzijiang looks interesting; tests support $0.940 – 0.980 (8 Feb 21)

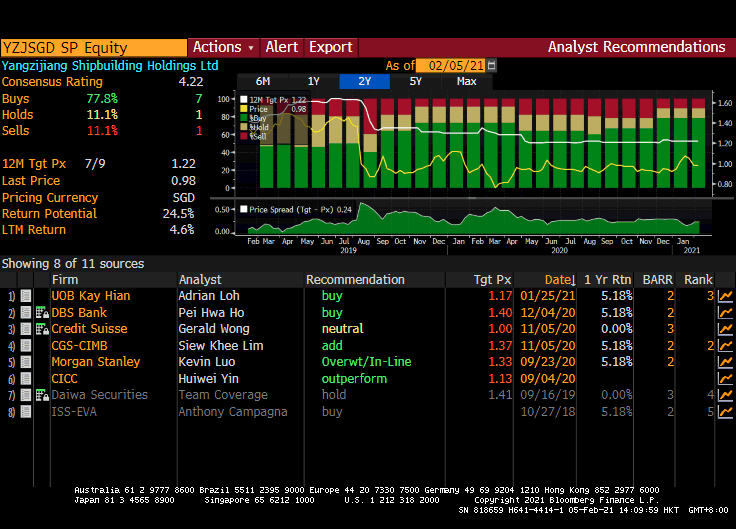
Yangzijiang (“YZJ”) has weakened approximately 13% from $1.11 on 13 Jan 2021 to close $0.970 on 5 Feb 2021. It has significantly underperformed STI (STI only dropped around 3% over the same period) and is the top STI constituent stocks with the highest potential return (see HERE). Why is it interesting? Read on for more…   Interesting points on YZJ a) Orders are likely to improve in FY21F Based on DBS Research 3 Dec 2020 report, the surge in China (Export) Containerized Freight Index (highest since Mar 2015) and the tripling of the Baltic Dry Index may prompt ship owners […]

Singpost – grossly oversold; closes at prices last seen in May 2009! (2 Mar 2020)

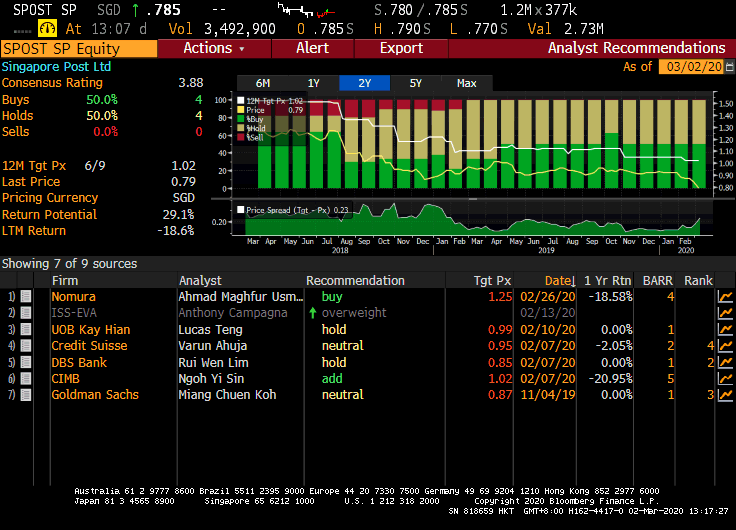
Dear all, It has been an extremely busy and hectic period with the U.S. indices clocking in their largest record weekly percentage drop last week. This week, Singpost caught my attention. Singpost has fallen 17.4% from its intraday high of $0.950 on 3 Jan 2020 to close at $0.785 today which is the lowest close since 5 May 2009. RSI closes at a grossly oversold level 10.7, almost at an all-time low last seen in June 2003. Why does it attract my attention? Read on for more.   Chart – Seems to indicate selling pressures may ease in the near […]

Chasen – a bullish double bottom making in the making? (23 Oct 19)

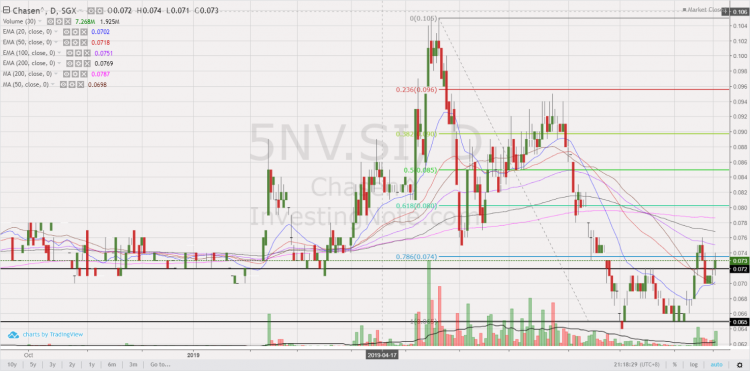
Dear all, This week, Chasen catches my attention as it seems to be forming a bullish double bottom on its chart. I have appended my personal chart analysis, together with some potential positive and negative points on the company. Read on for more below.   Chasen’s chart analysis Based on my personal interpretation of Chasen’s chart, it seems to have tested its double bottom neckline around $0.070-0.072 for the past few days. For the past two days, it managed to close higher consecutively with above average volume. In fact, Chasen closed today with 7.3m shares changing hands, 3.8x above its […]

S&P500 logged its largest one day fall since Jan. Buy more, or head to the exit? (27 Mar 2019)

Dear readers, Last Fri, S&P500 logged its largest one day fall since 3 Jan 2019, due in part to the weak European PMI and the yield curve inversion between U.S. 3-month bill and 10-year note yields. At the time of writing this, Dow closed 0.55% higher on Tues as U.S. 10 year bond yields stabilise. Is last Fri’s fall the precursor to something more serious? Or it is a false alarm?   First things first, what are the reasons for the sharp rally since late Dec? S&P500 has rallied approximately 20.1%, or 471 points from the intra-day low of 2,347 […]

S&P500 has slumped 13.7% in Dec, largest percentage fall since 1931! Has the bull market ended? (23 Dec 18)

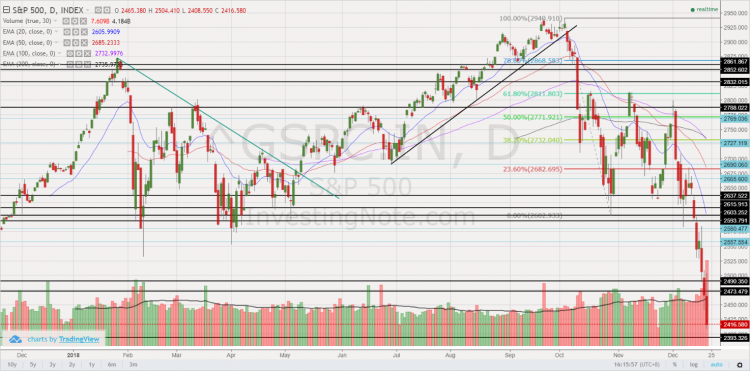
Dear all After hitting an intra-day high of 2,941 on 21 Sep 2018, S&P500 has tumbled 17.9% or 525 points to close 2,416 on 21 Dec 2018. In fact, S&P500 has just logged the worst monthly performance in Dec since 1931! Dow has also fallen 3,535 points from the intraday high of 25,980 on 3 Dec 2018 and 4,507 points from the intraday high of 26,952 on 3 Oct 2018. What is happening? Is Armageddon coming?   Most things have not changed since 21 Sep, except for… In Sep, when S&P500 hit 2,940, the usual concerns were also there, namely […]