Markets – diverging signs from technicals and fundamentals. What should we do? (4 Apr 2022)

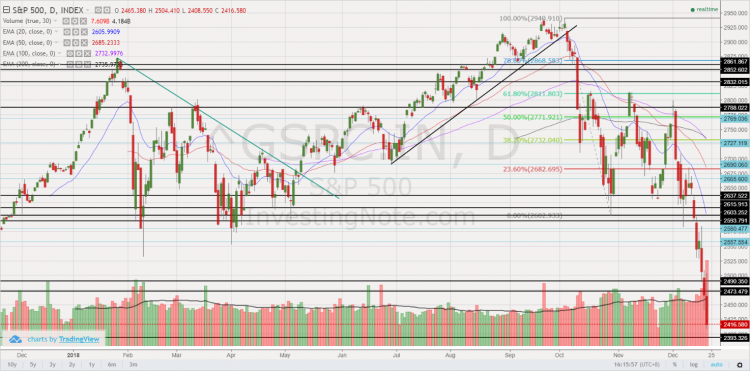
Dear all March has been a roller coaster month. Hong Kong market, represented by Hang Seng index touched multi-year lows around 14-15 Mar and has rebounded approximately 21% from the intraday lows. S&P500 performed well too with a third consecutive weekly rise. With reference to my writeup (click HERE) published on 6 Mar 2022, I mentioned that a) Odds are likely of a downward push first I mentioned that based on chart, odds are higher for a downwards move for both S&P500 and STI, to retest the previous support around 4,115 – 4,222 and 3,138 – 3,200 (with 3,175 a […]

STI at 3,051 – Presents some attractive opportunities (3 Oct 2021)

Dear all With reference to my market outlook published on National Day (see HERE), both STI and Hang Seng have hit their highs on 10 Aug and 11 Aug respectively before dipping. Based on Table 1 below, S&P500, Hang Seng and STI have fallen 1.8%, 6.1% and 4.0% respectively since my writeup. Table 1: Indices’ performance since my last writeup Source: Ernest’s compilations Amid the recent weakness, you may be wondering whether it is a good time to accumulate on weakness. Before we get to this, let’s take a look at the indices’ charts.   S&P500 closed 4,357 Based on […]

Markets are “bubblish”, or aren’t they? (5 Apr 2021)

Dear all Markets have been on a tear for the past five months. Since my write-up published on 1 Nov 2020, citing opportunities in our Singapore market (click HERE for the write-up), STI has soared 786 points, or 32.4% from 2,424 on 30 Oct 2020 to close 3,210 on 5 Apr 2021 (intra-day high today was 3,212). At the time of writing this, S&P500 futures are trading at 4,040, translating to around 24% gain over the same period. In fact, STI is the 2nd best performing market for 1Q2021 amongst 18 global benchmarks. Are markets in the midst of a […]

Chasen – a bullish double bottom making in the making? (23 Oct 19)

Dear all, This week, Chasen catches my attention as it seems to be forming a bullish double bottom on its chart. I have appended my personal chart analysis, together with some potential positive and negative points on the company. Read on for more below.   Chasen’s chart analysis Based on my personal interpretation of Chasen’s chart, it seems to have tested its double bottom neckline around $0.070-0.072 for the past few days. For the past two days, it managed to close higher consecutively with above average volume. In fact, Chasen closed today with 7.3m shares changing hands, 3.8x above its […]

S&P500 has slumped 13.7% in Dec, largest percentage fall since 1931! Has the bull market ended? (23 Dec 18)

Dear all After hitting an intra-day high of 2,941 on 21 Sep 2018, S&P500 has tumbled 17.9% or 525 points to close 2,416 on 21 Dec 2018. In fact, S&P500 has just logged the worst monthly performance in Dec since 1931! Dow has also fallen 3,535 points from the intraday high of 25,980 on 3 Dec 2018 and 4,507 points from the intraday high of 26,952 on 3 Oct 2018. What is happening? Is Armageddon coming?   Most things have not changed since 21 Sep, except for… In Sep, when S&P500 hit 2,940, the usual concerns were also there, namely […]