Dear all
With reference to my market outlook published on National Day (see HERE), both STI and Hang Seng have hit their highs on 10 Aug and 11 Aug respectively before dipping. Based on Table 1 below, S&P500, Hang Seng and STI have fallen 1.8%, 6.1% and 4.0% respectively since my writeup.
Table 1: Indices’ performance since my last writeup
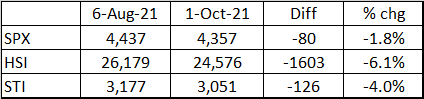
Source: Ernest’s compilations
Amid the recent weakness, you may be wondering whether it is a good time to accumulate on weakness. Before we get to this, let’s take a look at the indices’ charts.
S&P500 closed 4,357
Based on Chart 1 below, S&P500 has breached its uptrend line established since Mar 2020. In the short term, S&P500 seems to be on a downtrend as evidenced by its declining 6D, 20D, 50D EMA. However, on a longer perspective, its 200D EMA, 200D SMA are still rising. S&P500 has already hit its first 5% pullback from its recent high this year. It is noteworthy that S&P500 has touched 4,306 on 20 Sep and 30 Sep. On 1 Oct, it went below 4,306 but managed to close at 4,357 which may be an early positive sign to signal buyers continue to buy on dips. If S&P500 can close above 4,443 (50D SMA) on a sustained basis, this will be a more reliable signal and indicates that the short-term bearish feel in the chart is negated. Conversely, a sustained breach below 4,306 with volume expansion may point to an eventual technical measured target of around 4,150.
Near term support: 4,333 / 4,306 / 4,288 / 4,258
Near term resistances: 4,370 / 4,395 / 4,412 / 4,443
Chart 1: S&P500 closes well on 1 Oct, indicating buyers continue to buy on dips

Source: InvestingNote 3 Oct 21
Hang Seng closed 24,576
Based on Chart 2, Hang Seng has breached the uptrend line established since Mar 2020. It has also breached its 200D EMA and 200D SMA on 19 July 2021 and has remained below since then. During the recent bounce, it was resisted at 24,827 which is near to my critical support turned resistance area 24,840. A sustained breach below 24,840 points to an eventual technical measured target of around 23,120. Although this target seems valid for now, it is noteworthy that Hang Seng seems to be holding quite well recently and may have already absorbed some selling. I will be monitoring whether Hang Seng can close above 24,840 (an early positive sign) and more importantly, whether it can close above its rising trend line (currently around 25,400). If Hang Seng can close above its rising trend line, it will negate the bearish tinge in the chart.
Near term supports: 24,200 / 23,700 / 23,500 / 23,120 – 23,250
Near term resistances: 24,840 / 24,970 – 25,000 / 25,320 – 25,400
Chart 2: Hang Seng – levels to watch out for 24,840 & 25,400
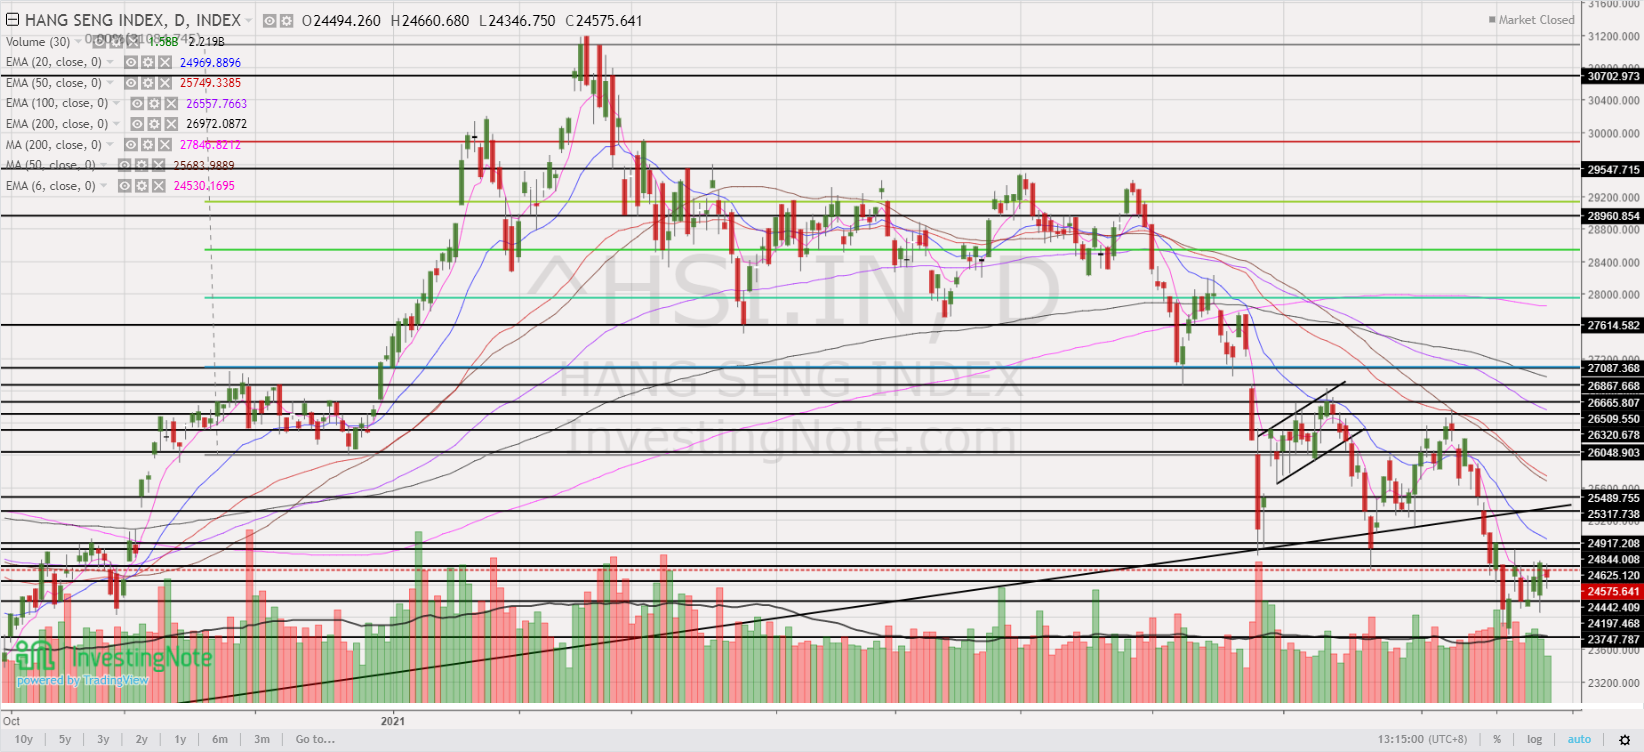
Source: InvestingNote 3 Oct 21
STI closed 3,051
Based on Chart 3, STI is trading in a range around 3,038 – 3,108 for the past one month. Notwithstanding the negatively placed DIs, ADX is declining and closes at 20.6 on 1 Oct 2021. Unlike Hang Seng, STI seems to be relatively more resilient and is still holding above its 200D EMA (currently around 3,049). A sustained break below 3,038 points to an eventual measured technical target 2,968. Based on the recent chart and price action, it is less likely for STI to reach 2,968, unless there is a sharp deterioration in market sentiment.
Near term supports: 3,049 / 3,038 – 3,040 / 3,024 – 3,027 / 3,015 / 3,000 – 3,005
Near term resistances: 3,077 – 3,080 / 3,097 – 3,100 / 3,110
Chart 3: STI chart looks more resilient than Hang Seng
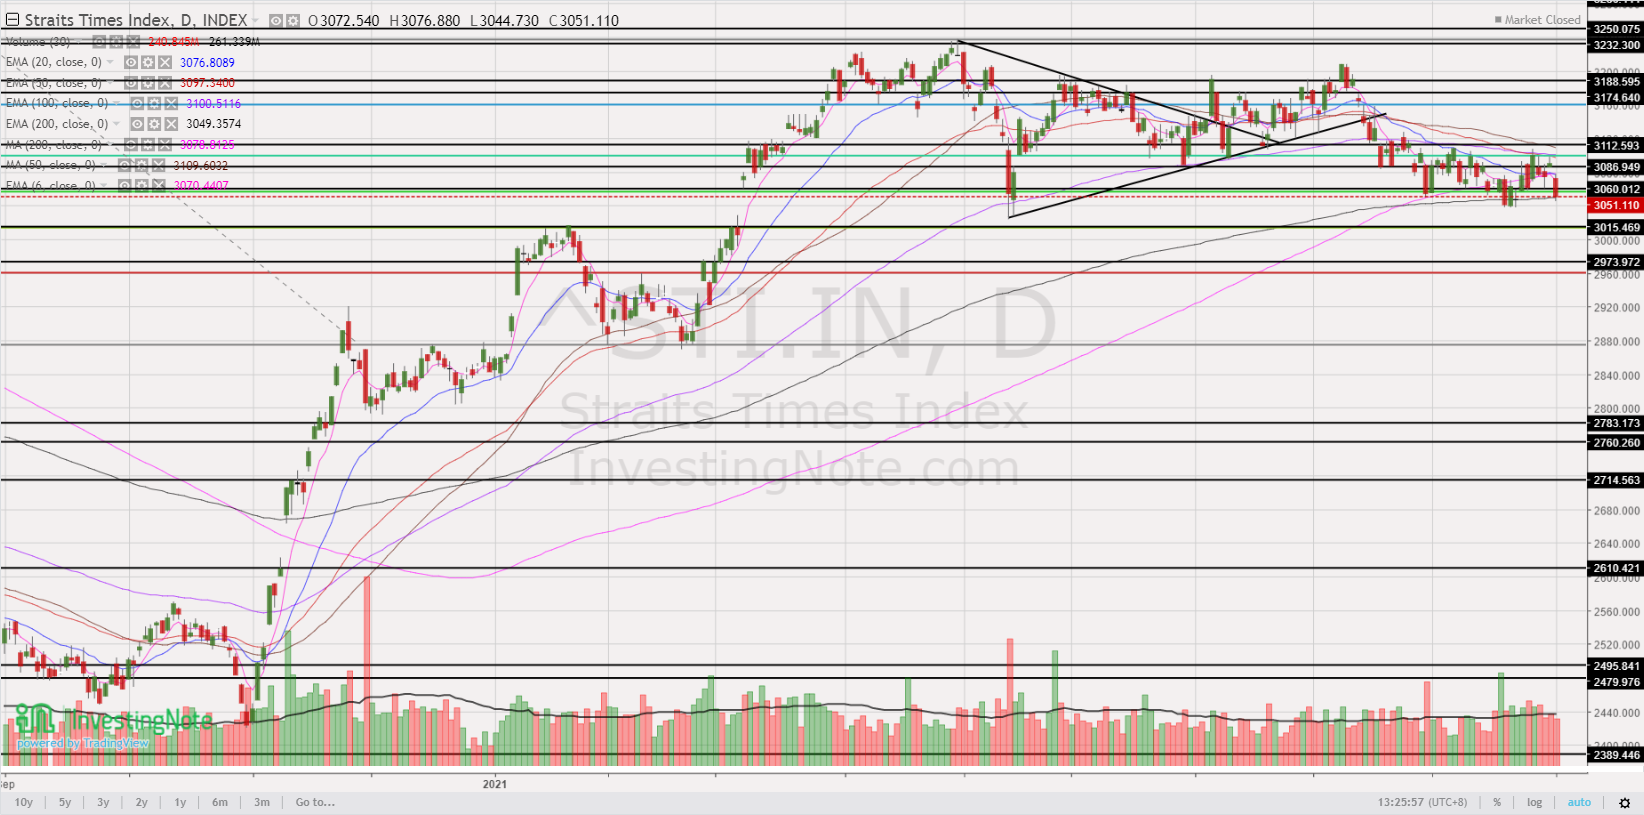
Source: InvestingNote 3 Oct 21
After looking at the indices’ charts, I personally prefer STI due to its relatively more resilient nature vs Hang Seng and potentially less downside as compared to S&P500 (STI 2,968 vs 3,051 close; as compared to S&P500 4,150 vs 4,357 close).
What are the stocks to take a look on weakness?
I have sorted some SGX listed stocks by total potential return using Bloomberg data as of the close of 30 Sep 2021.
I have generated two tables below and have appended the top ten and bottom 10 stocks for readers. Table 2 lists the top 10 stocks sorted by highest total potential return. These top 10 stocks offer a total potential return of between 44 – 88%, based on the closing prices as of 30 Sep 2021. (Most importantly, please refer to the criteria and caveats below). [My clients will receive the entire list of my compilation of 101 stocks sorted by total potential return immediately.]
Table 2: Top 10 stocks sorted by total potential return
Source: Bloomberg 30 Sep 2021
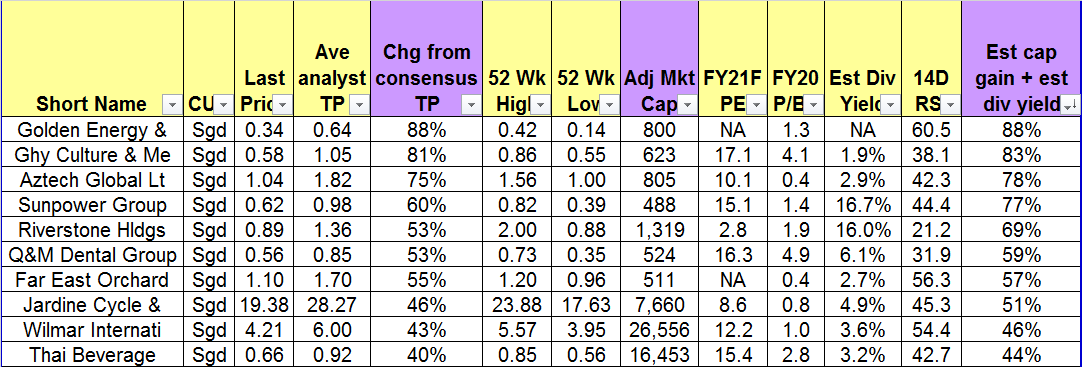
Table 3 lists the bottom 10 stocks sorted by total potential return. These bottom 10 stocks offer a total potential return of around +8% to -10%, based on the closing prices as of 30 Sep 2021.
Table 3: Bottom 10 stocks sorted by total potential return

Source: Bloomberg 30 Sep 2021
Criteria in generating the above tables
a) Mkt cap >= S$450m to potentially capture more market opportunities;
b) Presence of analyst target price.
Very important notes
a) This compilation is just a first level stock screening, sorted purely by my simple criteria above. It does not necessary mean that Golden Energy is better than Wilmar in terms of stock selection. Readers are still required to do their own due diligence and form their own independent investment decisions;
b) Even though I put “Ave analyst target price”, some stocks may only be covered by one analyst hence may be subject to sharp changes. Also, analysts may suddenly drop coverage. Furthermore, Bloomberg may not have captured all the analysts’ target prices and some of these target prices may not be the most updated figures;
c) Analyst target prices and estimated dividend yield are subject to change anytime, especially after results announcement, or after significant news announcements;
d) The above highlighted stocks in green (visible to my clients but not for readers) are stocks which my private banking clients and I are looking at. Naturally, as I have a limited portfolio size and bandwidth, I do not intend to buy all the highlighted stocks. However, some of my private banking clients have a bigger portfolio and hence they have the capacity to accumulate 10-20 stocks (not only limited to Singapore) with meaningful quantities. Notwithstanding this, we may change our stocks accordingly as variables change (e.g., newsflow on the specific stocks; prices have moved etc.) Among the green highlighted stocks, I am currently vested in Comfort Delgro, Q&M Dental, Yangzijiang. Do refer to my write-up on Comfort Delgro and Q&M Dental HERE.
e) I noted that Capitaland Investment Limited is not in the table above. I will put it in my compilation next month.
Readers who wish to receive the entire compilation of the 101 stocks sorted by total potential return can leave their contacts here http://ernest15percent.com/index.php/about-me/. I will send the list out to readers on 9 Oct.
Readers who wish to be notified of my write-ups and / or informative emails, can consider signing up at http://ernest15percent.com. However, this reader’s mailing list has a one or two-day lag time as I will (naturally) send information (more information, more emails with more details) to my clients first. For readers who wish to enquire on being my client, they can consider leaving their contacts here http://ernest15percent.com/index.php/about-me/
Disclaimer
Please refer to the disclaimer HERE
va online pharmacy mexican pharmacies shipping to usa
Great beat ! I wish to apprentice while you amend
your web site, how could i subscribe for a blog web site?
The account aided me a acceptable deal. I had been tiny bit acquainted of this
your broadcast offered bright clear concept