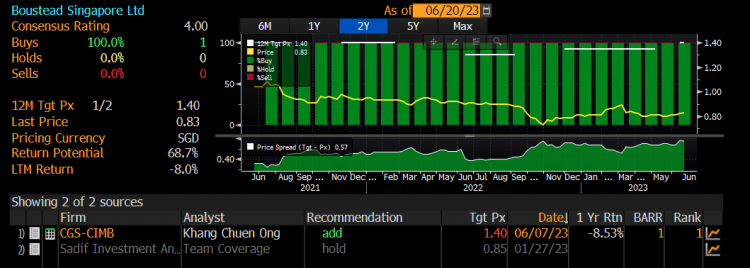
Figure 1_Boustead Singapore analyst target price 20 Jun 23

Boustead Singapore – chart poised for a bullish breakout! (23 Jun 23)

Dear all With reference to my write-up on Comfort Delgro dated 9 Jun 2023 (click HERE) where I pointed out that I am comfortable to accumulate Comfort Delgro for a trading play, Comfort Delgro closed at $1.03 on 9 Jun, the lowest close last since on 18 Mar 2004. Since my writeup, Comfort Delgro has fortunately appreciated nine out of ten trading days to close almost 15% higher at $1.18 today. This compares favourably with STI which moved up 0.2% over the same period. Another stock, Boustead Singapore has recently caught my attention due to its chart development. It closed […]

Table 1_Aztech ave analyst target 12 Apr 22

Aztech looks interesting – lowest forward PE among SG tech stocks with a 5.6% estimated dividend yield! (16 Apr 22)

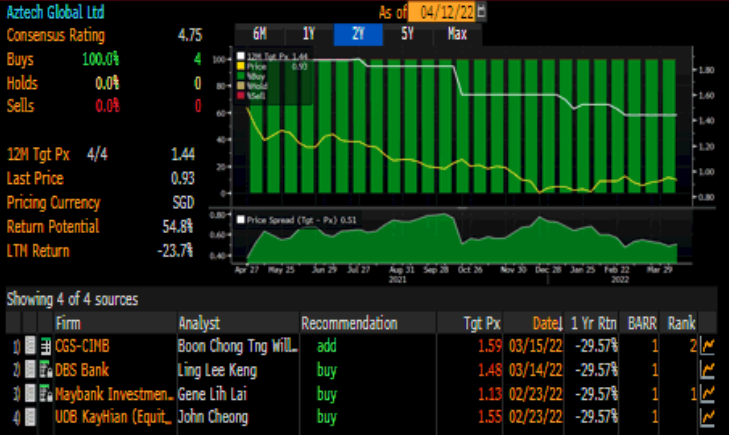
Dear all This week, Aztech has caught my attention amid rising volume with its 1QFY22F business update just around the corner. It has fallen approximately 39% from an intraday high of $1.56 on 27 Apr 2021 to close at $0.950 last Thursday. Let’s take a look on the interesting points and potential risks on Aztech.   Interesting points a) Analysts like Aztech with average target price $1.44 With reference to Figure 1 below, 4 analysts cover Aztech and all rate it a buy. Average analyst target price is around $1.44. If the analysts are right, Aztech offers a potential capital […]

Table 2_Top ten stocks sorted by total potential return 28 Feb 22

Markets may continue to be volatile but also present valuable opportunities ahead (6 Mar 2022)

Dear all We are two months into 2022. How is your portfolio doing? With reference to my writeup (click HERE) published on 17 Feb 2022, I mentioned that STI is likely to face headwinds in the near-term and SG banks’ share prices are likely to peak around 7-18 Feb based on past observations.   Coincidentally a) STI peaked on 17 Feb. In fact, STI has tumbled 6.9%, or 239 pts from its intraday high 3,466 on 17 Feb to close 3,227on 4 Mar. Last Friday’s intraday low was 3,208. More about its chart below. b) Banks – DBS peaked on […]

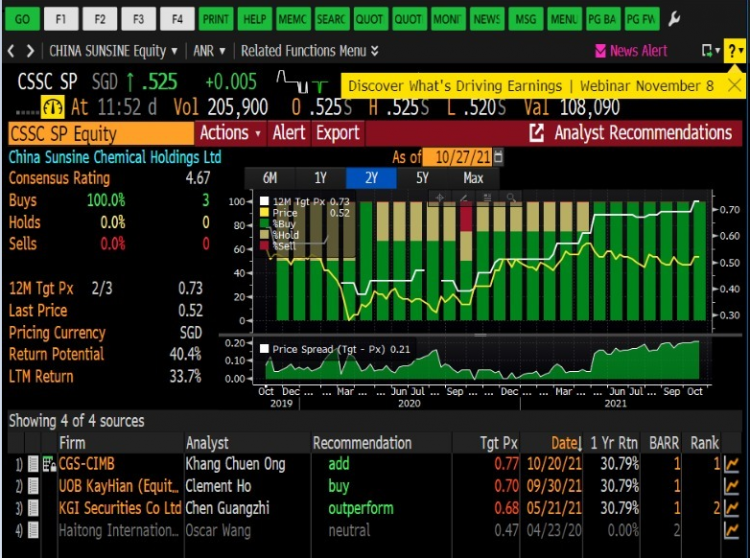
Fig 1_Sunsine average analyst target price 27 Oct 21

3 interesting charts to take note: GSS Energy, China Sunsine and Sing Medical (28 Oct 2021)

Dear all With reference to my market outlook published on 3 Oct 2021 (see HERE) where I cited opportunities in our Singapore market, our Singapore market (represented by STI) has jumped 154 points, or 5.1% since 1 Oct. Amid the recent strength, is it too late to plough into the markets? Are there still stocks who may have further upside? Based on my personal chart observation, GSS Energy, China Sunsine and Sing Medical have interesting / bullish charts’ setups which may be interesting to take a look.   GSS Energy Based on Chart 1 below, GSS seems to be on […]

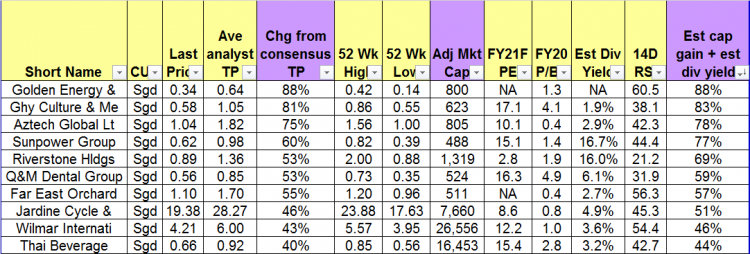
Table 2_Top ten stocks sorted by total potential return 30 Sep 21

STI at 3,051 – Presents some attractive opportunities (3 Oct 2021)

Dear all With reference to my market outlook published on National Day (see HERE), both STI and Hang Seng have hit their highs on 10 Aug and 11 Aug respectively before dipping. Based on Table 1 below, S&P500, Hang Seng and STI have fallen 1.8%, 6.1% and 4.0% respectively since my writeup. Table 1: Indices’ performance since my last writeup Source: Ernest’s compilations Amid the recent weakness, you may be wondering whether it is a good time to accumulate on weakness. Before we get to this, let’s take a look at the indices’ charts.   S&P500 closed 4,357 Based on […]

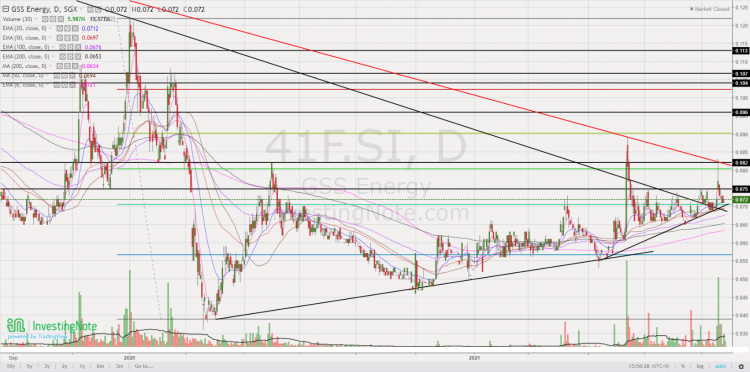
GSS Energy chart 24 Sep 21

GSS Energy looks interesting; key level for potential bullish breakout is at $0.075 (27 Sep 2021)

Dear all Of late, GSS Energy (“GSS”) has caught my attention. It has dipped from an intraday high of $0.083 on 17 Sep 2021 and has weakened to $0.072 on 24 Sep 2021. This weakness may be attributed to profit taking and contra players exiting or rolling their positions. 24 Sep is T+5 of its high-volume day on 17 Sep. My personal guess is that most of the contra players may have already exited (i.e., selling may have been largely exhausted). It may be time to relook into GSS Energy. Let’s take a look.   Basis a) E mobility business […]

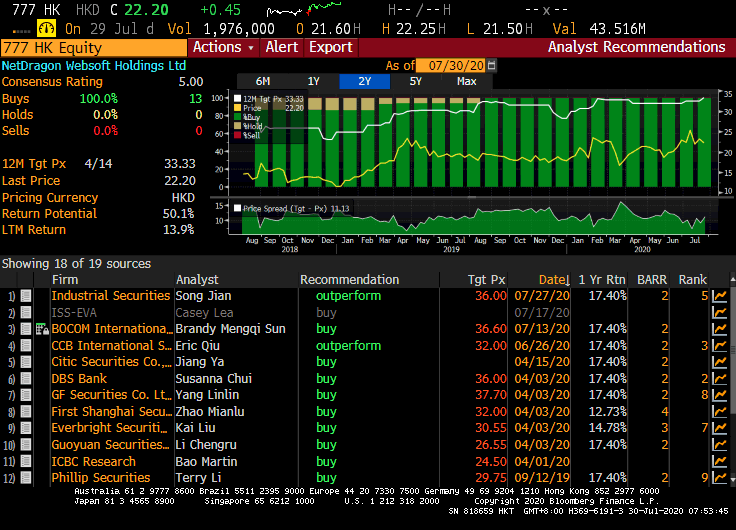
Analyst 30 Jul 20

China Everbright Water and NetDragon look interesting… (30 Jul 2020)

This week, notwithstanding the continuous interest in glove companies, pharmaceutical companies etc, there are some companies which seem to have some steady inflows, based on chart observations. Two companies come to my mind, namely NetDragon and China Everbright Water Limited (“CEWL”). What is so interesting about the above companies? Let’s take a closer look at its chart and other noteworthy points. 1. NetDragon – on an uptrend, with all 13 analysts calling it a BUY Company description – before I delve into the chart… Some readers may not be familiar with NetDragon (HKSE: 0777). According to NetDragon company description, it […]

WhatsApp Image 2020-06-23 at 11.44.11

Chart alert! Yoma may breach $0.280 in the near term (23 Jun 2020)

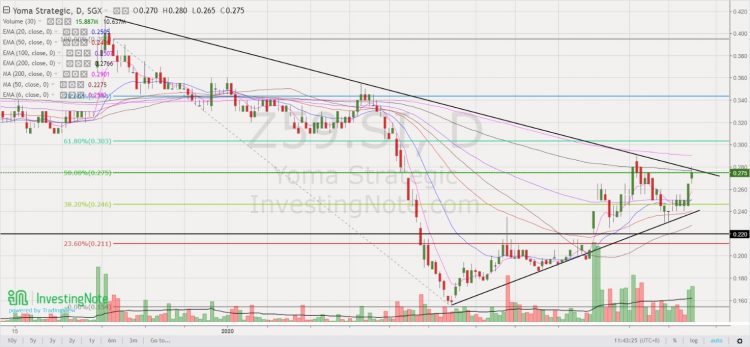
This week, Yoma catches my attention on a spike in share price, accompanied with an expansion in volume. Let’s take a look.   Chart analysis Yoma’s chart has been on a short-term uptrend since 24 Mar. ADX last trades 22.2, amid positively placed Dis, indicative of a trend. Its short term exponential moving averages (“EMA”) are rising steadily and its long term moving averages (namely 200D EMA and 200D SMA) are plateauing. Indicators such as OBV and RSI are strengthening. Volume has picked up significantly today and yesterday which may signify good odds of breaching its key resistance $0.275 – […]

Analyst 8 Jun 20

China Everbright Water – bullish break above trading range (10 Jun 2020)

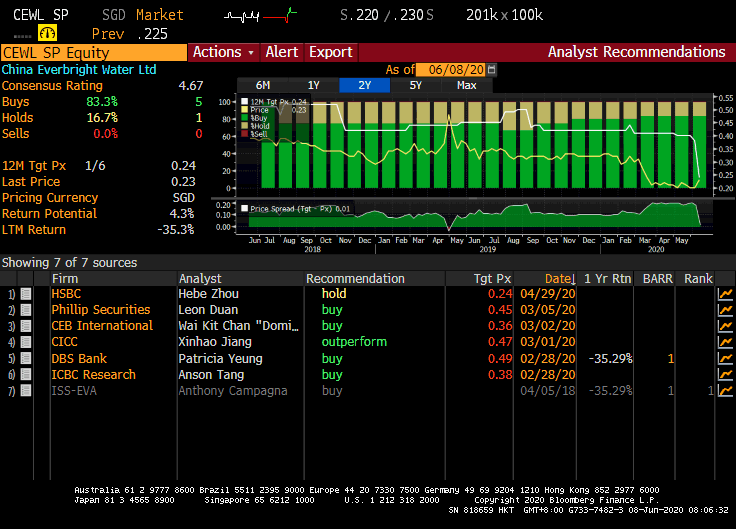
This week, China Everbright Water Limited (“CEWL”) catches my attention this week. Since 17 Mar 2020, CEWL has been trading sideways from $0.200 – 0.230. Based on chart, CEWL seems to be on the verge of a breakout. It last trades at $0.235. What is so interesting about CEWL? Let’s take a closer look at its chart and other noteworthy points.   CEWL – Broke out of 2+ month trading range with volume expansion Bullish chart underpinned by rising EMAs and volume Based on Chart 1 below, since 17 Mar 2020, CEWL has been trading sideways from $0.200 – 0.230. […]

analyst 2 Mar 20

Singpost – grossly oversold; closes at prices last seen in May 2009! (2 Mar 2020)

Dear all, It has been an extremely busy and hectic period with the U.S. indices clocking in their largest record weekly percentage drop last week. This week, Singpost caught my attention. Singpost has fallen 17.4% from its intraday high of $0.950 on 3 Jan 2020 to close at $0.785 today which is the lowest close since 5 May 2009. RSI closes at a grossly oversold level 10.7, almost at an all-time low last seen in June 2003. Why does it attract my attention? Read on for more.   Chart – Seems to indicate selling pressures may ease in the near […]