Markets may continue to be volatile but also present valuable opportunities ahead (6 Mar 2022)

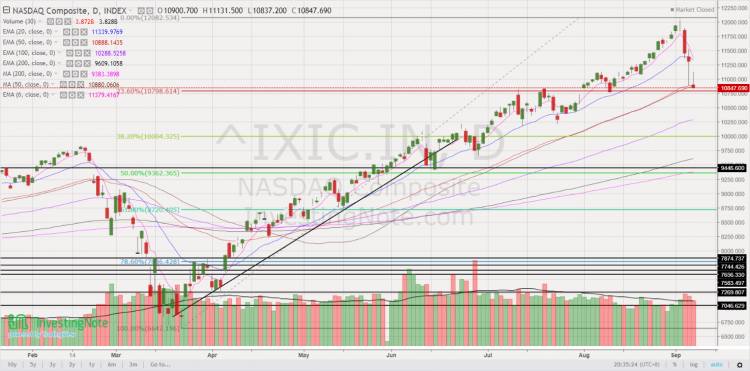
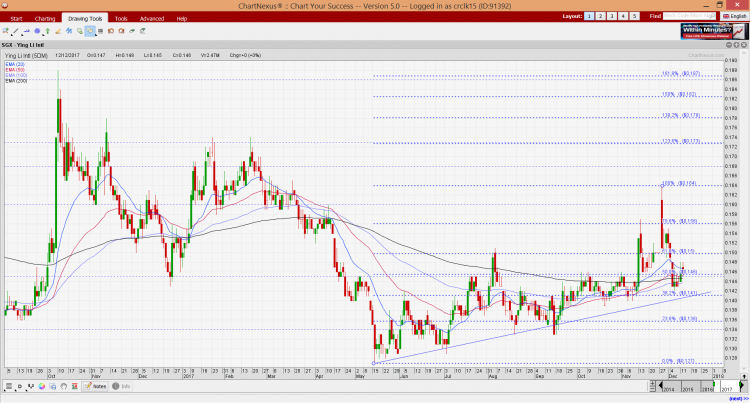
Dear all We are two months into 2022. How is your portfolio doing? With reference to my writeup (click HERE) published on 17 Feb 2022, I mentioned that STI is likely to face headwinds in the near-term and SG banks’ share prices are likely to peak around 7-18 Feb based on past observations.   Coincidentally a) STI peaked on 17 Feb. In fact, STI has tumbled 6.9%, or 239 pts from its intraday high 3,466 on 17 Feb to close 3,227on 4 Mar. Last Friday’s intraday low was 3,208. More about its chart below. b) Banks – DBS peaked on […]

STI is up 10.1% YTD; may face profit taking in the near-term (16 Feb 2022)

Dear all STI has been on a tear since the start of the year. With reference to my write-up published on 5 Jan 2022 (click HERE) citing that Asian indices are likely to outperform that of the U.S. market in 2022, STI has indeed notched strong year to date (“YTD”) gains of 10.1% to close 3,439 on 16 Feb 2022. This outperformance is especially stark if we compare it to S&P500’s -6.1% YTD returns. As I have shared with Lianhe Zaobao on 9 Feb 2022, I personally feel that our STI is overbought in the near term with several near-term […]

STI at 3,051 – Presents some attractive opportunities (3 Oct 2021)

Dear all With reference to my market outlook published on National Day (see HERE), both STI and Hang Seng have hit their highs on 10 Aug and 11 Aug respectively before dipping. Based on Table 1 below, S&P500, Hang Seng and STI have fallen 1.8%, 6.1% and 4.0% respectively since my writeup. Table 1: Indices’ performance since my last writeup Source: Ernest’s compilations Amid the recent weakness, you may be wondering whether it is a good time to accumulate on weakness. Before we get to this, let’s take a look at the indices’ charts.   S&P500 closed 4,357 Based on […]

Recent weakness provides accumulation opportunities (9 Sep 20)

Dear all Based on Table 1 below, U.S. indices have fallen between 5.5% – 10% from the close of 2 Sep to 8 Sep. Nasdaq led the decline with a 10% drop. These are interesting times indeed! Why do I say so? Read on below. Table 1: Performance of various indices from 2 Sep to *8 Sep 20 Source: Ernest’s compilations (*STI and Hang Seng are based on 9 Sep closing prices) In my personal opinion, this recent U.S. market weakness provides accumulation opportunities for the well prepared and for those who have been waiting on the side-lines to accumulate […]

Stocks sorted by total potential return (7 Sep 2020)

Dear all U.S. markets have fallen sharply with Nasdaq dropping almost 1,200 points or 10% from an intraday high of 12,074 on 2 Sep to an intraday low of 10,876 last Fri. For example, Apple Inc. has lost $219b in market cap from the close of 1 Sep through 3 Sep which is larger than the market cap of Exxon Mobil Corp., for long the world’s largest company! In view of the recent decline, some clients have asked me which are the stocks that they can look at. Below is my compilation of the top ten stocks and the bottom […]

Ying Li’s chart – consolidating nicely around $0.14+, before the next up-move? (12 Dec 17)

Ying Li’s chart seems to be consolidating nicely around $0.14+. Where will it go from here?   Personal chart observation With reference to Chart 1 below, Ying Li surged to an intraday high of $0.164 on 28 Nov 2017 immediately after the divestment announcement (See elaboration and announcement link below), before profit taking set in. Since then, Ying Li seems to be consolidating around $0.14+. Since 16 May 2017, Ying Li has been setting higher lows and higher highs. All the exponential moving averages (“EMAs”) have either stopped declining, or are moving higher. Although Ying Li’s share price has languished […]