Numerous trading opportunities as Singapore corporates report results (9 Aug 2022)

Dear all, Happy National Day! How has your portfolio been year to date? With reference to my writeup published on 3 Jul 2022 (click HERE), I mentioned that there are likely to be opportunities in the next few weeks. Post my writeup, S&P500 touched an intraday low of 3,722 on 14 Jul before closing up 418 points or 11.2% at 4,140 yesterday. In fact, S&P500 posted its best monthly gain in July, since Nov 2020. STI touched an intraday low of 3,088 on 15 Jul before trading up 183 points or 5.9% at 3,271 yesterday. Our Singapore banks started to […]

Markets – diverging signs from technicals and fundamentals. What should we do? (4 Apr 2022)

Dear all March has been a roller coaster month. Hong Kong market, represented by Hang Seng index touched multi-year lows around 14-15 Mar and has rebounded approximately 21% from the intraday lows. S&P500 performed well too with a third consecutive weekly rise. With reference to my writeup (click HERE) published on 6 Mar 2022, I mentioned that a) Odds are likely of a downward push first I mentioned that based on chart, odds are higher for a downwards move for both S&P500 and STI, to retest the previous support around 4,115 – 4,222 and 3,138 – 3,200 (with 3,175 a […]

Will Singapore stocks outperform U.S. stocks in 2022? (5 Jan 2022)

Dear all With reference to my market outlook published on 7 Nov (see HERE) citing our Singapore market may face near term profit taking, STI dropped 201 points, or 6.6% from 3,242 on 5 Nov to close at 3,041 on 30 Nov. As we start 2022, various investment banks and research houses have put forth their views on how the various markets will perform. In this write-up, I will share how the markets have performed in 2021 and my market outlook in 2022.   How did the markets perform in 2021? Based on Table 1 below, it is evident that […]

Stocks sorted by total potential return (7 Sep 2020)

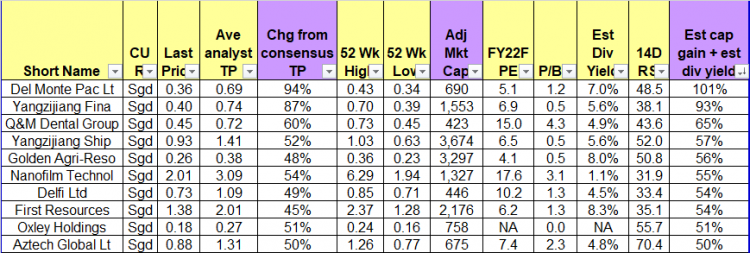
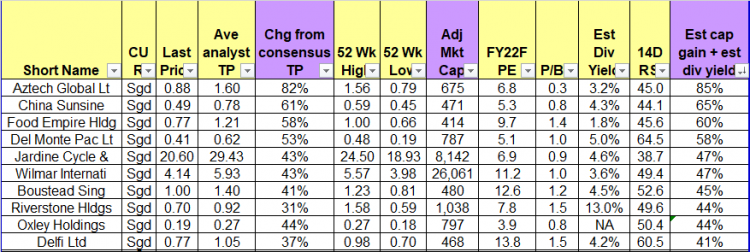
Dear all U.S. markets have fallen sharply with Nasdaq dropping almost 1,200 points or 10% from an intraday high of 12,074 on 2 Sep to an intraday low of 10,876 last Fri. For example, Apple Inc. has lost $219b in market cap from the close of 1 Sep through 3 Sep which is larger than the market cap of Exxon Mobil Corp., for long the world’s largest company! In view of the recent decline, some clients have asked me which are the stocks that they can look at. Below is my compilation of the top ten stocks and the bottom […]

Chasen – a bullish double bottom making in the making? (23 Oct 19)

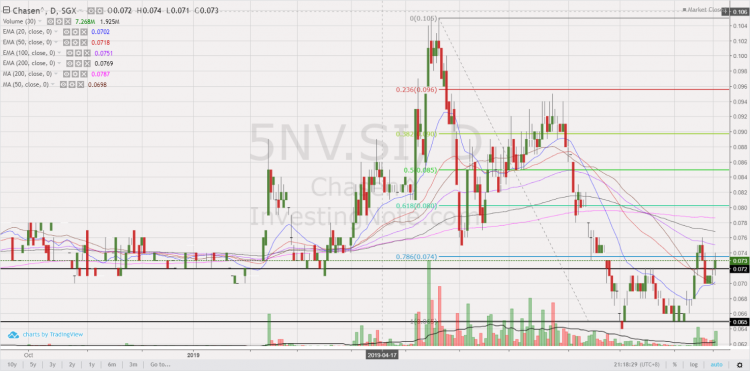
Dear all, This week, Chasen catches my attention as it seems to be forming a bullish double bottom on its chart. I have appended my personal chart analysis, together with some potential positive and negative points on the company. Read on for more below.   Chasen’s chart analysis Based on my personal interpretation of Chasen’s chart, it seems to have tested its double bottom neckline around $0.070-0.072 for the past few days. For the past two days, it managed to close higher consecutively with above average volume. In fact, Chasen closed today with 7.3m shares changing hands, 3.8x above its […]