Markets hit by selling pressure. Is it time to BUY? (23 Oct 23)
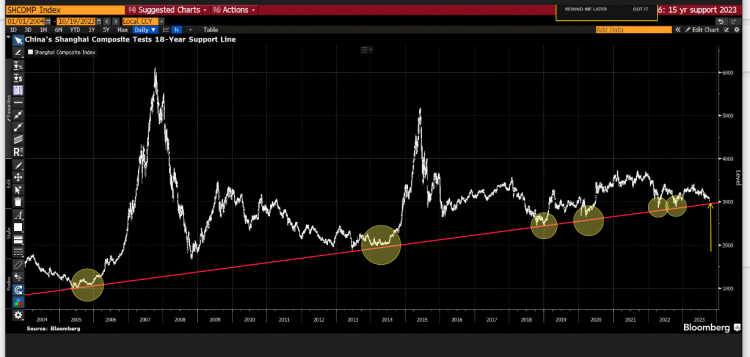
Dear all It has been some time since I last wrote an article on market outlook. I have been extremely busy for the past three months where I have been meeting companies and other associates. (Check out my LinkedIn HERE). I have also just arranged an exclusive meetup with Lendlease Reit Manager CEO, Kelvin Chow and Head of Investor Relations, Ling Bee Lin with my clients last Friday. (Click HERE). As of last Friday, Lendlease Reit’s market capitalisation is around S$1.16b. With reference to Chart 1 below, October continues to see the third monthly outflows of funds from China equity markets. […]