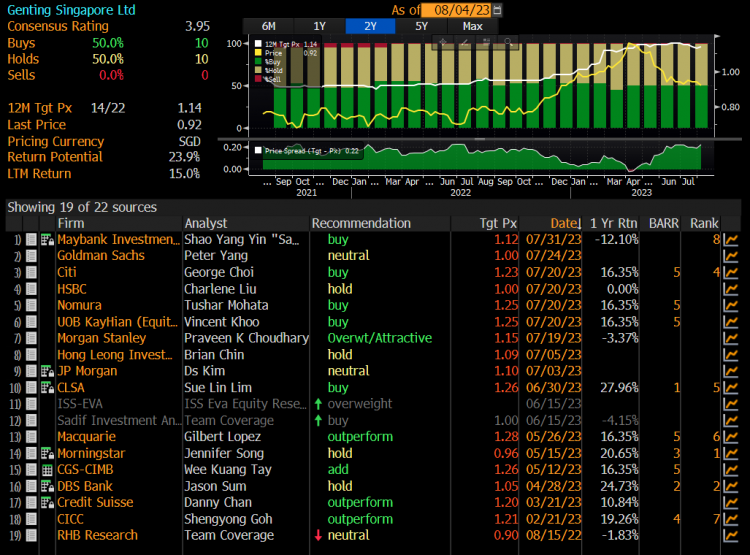
Chart 1_600329 CH stock price for the past 3 odd years

Nasdaq has soared 14% in 1 month! Should we chase this rally? (30 Jan 23)

Dear all It has been a busy January. As you are aware, I have kept my powder dry by taking it slow and easy in Dec and have taken some opportunistic positions amid the sell-off in Dec. Just to recap, with reference to my writeup published on 3 Dec (click HERE), where I mentioned that I am taking it slow and easy in Dec, S&P500 and STI fell by 5.9% and 1.2% respectively in Dec. In fact, S&P500 registered the worst Dec performance in four years. However, Hang Seng was still very resilient and jumped 6.4% in Dec on continual […]

Chart 1_S&P500 returns around recession 23 May 22

Markets – possible technical rebound in the near term but likely short lived (26 May 2022)

Dear all I have been extremely busy with work, hence the dearth of articles on my blog. Dow has closed lower for the eighth consecutive week. This marks the longest period of consecutive weekly losses since 1923! S&P500 has registered a seventh week of losses, its longest weekly losing streak since March 2001. Are the markets going to drop into an abyss? Or has the bottom been reached? Before we delve into this, let’s recap on my earlier market outlook article dated 4 Apr 22 (click HERE). Previously, I wrote that I am more inclined towards the bearish / prudent […]

Table 1_Top ten stocks sorted by total potential return 29 Oct 21

STI – having closed at a record YTD high, will it continue higher? (7 Nov 2021)

Dear all With reference to my market outlook published on 3 Oct (see HERE) citing opportunities in our Singapore market, STI has soared 191 points, or 6.3% from 3,051 on 1 Oct to close at a year to date high 3,242 on 5 Nov. Will STI continue to march higher, or will there be some profit taking?   Very briefly, my personal view is It is likely that STI may face some profit taking in the near term, attributable in part to the following factors: a) With reference to Figure 1 below, MSCI Singapore index will undergo a rebalancing in […]

title image

Why Property Investors should look at the Private Resale Condo Segment (11 April 2020)

This write-up was reproduced with permission from Ray’s Estate Clinic, written by Founder, Raymond Chng. Please refer to the end of the article for more information on Raymond. With the record number of new launch properties on the market in 2019 and 2020, all eyes have been on the new launch segment of the property market. Some new property buyers believe that they should buy new properties because they would be buying at the lowest price in the development, and therefore are more likely to make profits when the property obtains TOP. These same property buyers are afraid of buying […]

Nasdaq chart 27 Sep 19

Nasdaq – potential bearish head and shoulders formation in the making? (29 Sep 19)

With reference to my earlier write-up (click HERE) titled “S&P500 at 2,979 – limited potential upside (8 Sep 19)”, S&P500 touched intraday highs of 3,021 – 3,022 on 12 Sep 2019 and 19 Sep 2019 but it was still lower than the record intraday high of 3,028 on 26 July 2019. S&P500 closed at 2,962 on 27 Sep 2019. Hang Seng and STI touch one-month intraday highs on 13 Sep 2019 before profit taking sets in. October is likely a volatile month ahead given (just to cite a few examples) more news on trade talks (e.g. U.S vs China; U.S. […]

Table 1_Best World peer comparison

Best World – down 47% in 2 months! Buying opportunity or falling knife? (12 Apr 19)

With reference to my 19 Sep 2018 write-up (click HERE), Best World has appreciated approximately 147% from $1.35 on 19 Sep 2018 to touch an intra-day high of $3.33 on 13 Feb 2019. At that time, Best World has dropped out of my watchlist after its incredible rally. However, with its recent 47% tumble from its all-time intra-day high $3.33 on 13 Feb 2019 to trade $1.76 on 12 Apr 2019, it seems interesting again. Is this a buying opportunity or falling knife?   Why is it interesting? a) Valuations are more attractive now Based on Bloomberg (see Table 1), Best World […]

Tencent analyst target 12 Oct 18

Two interesting stock charts – Best World and Tencent (12 Oct 18)

Notwithstanding the sea of red in the equity markets for the past couple of days, these two stock charts caught my attention. They are Best World and Tencent.   Best World – retreats back to double bottom neckline Best World has dropped 9.2% from an intra-day high of $1.52 on 4 Oct 2018 to close $1.38 on 11 Oct 2018. Based on Chart 1 below, Best World is retreating back to its double bottom neckline of around $1.39. This seems to be a classic “break and re-test” resistance turned support pattern. There is a confluence of supports (50D, 100D and […]

Best World chart 19 Sep 18

Best World – potential bullish double bottom formation in the making? (19 Sep 18)

This week, Best World has caught my attention. Why is it interesting? a) Chart seems to be in the midst of a double bottom formation Best World has fallen 29% from an intraday high of $1.90 on 19 Mar 2018 to close $1.35 on 19 Sep 2018. It has been trading in a range $1.20 – 1.39 since 15 May 2018. Indicators are mixed with MACD and RSI exhibiting bullish divergences during this period. Except for 200D EMA which is levelling, all other EMAs are rising. 20D has already formed a golden cross formation with 50D EMA. Best World has […]

EC chart as of 29 Jun 18

EC World Reit – potential strong growth ahead (29 Jun 18)

Dear all, Reits are clearly not in our investors’ favour as evidenced by the 10.2% fall in FTSE Reit index (FSTAS8670.IN), which closed 786 on 29 Jun 2018, after hitting a multi-year high of 875 in Jan 2018. Most analysts or strategists will recommend reits with distribution per unit (“DPU”) growth, so as to combat the rise in interest rates. EC World Reit (“EC”) may be one with DPU growth. I have the privilege of meeting Mr Goh Toh Sim, Executive Director & CEO of EC and Mr Li Jinbo, Head of Investment of EC (“Management”) for a 1-1 discussion […]

Figure 3_Profits

Capital world has tumbled 46% since 29 Mar 17. What gives? Will it fall further? (1 Jun 17)

Capital World (formerly known as Terratech Group Limited) has slumped a whopping 46% from its intraday high of $0.240 on 29 Mar 2017 to close $0.130 on 1 Jun 2017. What has happened to cause such a massive fall? Will it fall further?   Company description Capital World is an innovative property developer that works with landowners on a joint venture basis to create value added property developments. Such joint venture requires minimal capital outlay and maximises investment returns. It is currently developing Project Capital City, an integrated property project comprising a retail mall, hotel and serviced suites and serviced […]