Frasers Property Limited – large market cap stock trading at rock bottom valuations! (16 Jun 24)
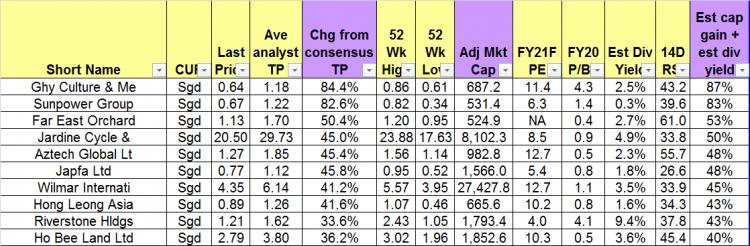
Dear all The past few weeks have been extremely busy from MSCI index rebalancing (where there are lots of opportunities to capitalise on); to 1-1 meetings and a site visit in Myanmar. This is why I have not been posting posts on my Linkedin (click HERE for my Linkedin) and only one article on my blog since 6 May 2024. While doing my usual stock screening of SGX listed stocks, I found out that Frasers Property Limited (FPL) has the lowest valuation at 0.3x P/BV, while being one of the largest market capitalisation stocks listed on SGX. FPL closed at […]