Dear all,
Based on my personal reading, since a couple of months ago, investor interest seems to be gradually rotating back into the reit sector. Several reits have caught my attention. For this write-up, I will focus on Lendlease Reit and Manulife US Reit.
1) Lendlease Reit closed $0.660
With reference to my write-up on Lendlease Reit dated 3 Jul 2023 (click HERE), I have compiled my key takeaways from my 1-1 meeting with Lendlease Reit’s management and from what I gather from the various analyst reports and my other readings into this write-up. As such, I will not be delving too much into its fundamentals. Please refer to my informative write-up HERE. For Lendlease Reit, I just want to point out two key aspects; its chart and what the investment community feels about Lendlease Reit.
A) Chart – Testing a multi times tested support
Based on Chart 1 below, Lendlease Reit has tested $0.650 – 0.655 numerous times on Oct 2022, Jan 2023, Mar 2023, May – Jul 2023. In fact, Lendlease Reit has tested $0.650 – 0.655 numerous times from late Jun to now. Indicators such as RSI, MFI and MACD seem to be gradually strengthening if I reference the lows on 9 Jun and 10 Jul.
Based on my pure personal observation of price action and chart, barring unforeseen circumstances, there are good odds that Lendlease Reit’s near-term support $0.650 – 0.655 should hold. A sustained breach above its downtrend line (currently around $0.670) with volume expansion is bullish for the chart. Conversely, a sustained downside break below $0.645 with volume expansion is bearish for the chart.
Near term supports: $0.650 – 0.655 / 0.645 / 0.630
Near term resistances: $0.665 – 0.670 / 0.680 / 0.695 – 0.705
Chart 1: Lendlease Reit’s support $0.650 – 0.655 should hold

Source: InvestingNote 11 Jul 23
B) Analysts are very positive on Lendlease Reit
With reference to Fig 1 below, eight analysts cover Lendlease Reit with either buy, add or outperform calls. Seven analysts have target prices ranging from $0.75 – 1.00. Coupled with the estimated dividend yield of around 7.1%, total potential return is approximately 36% if the consensus is right.
Fig 1: Average analyst target price $0.850; total potential return is approximately 36%!
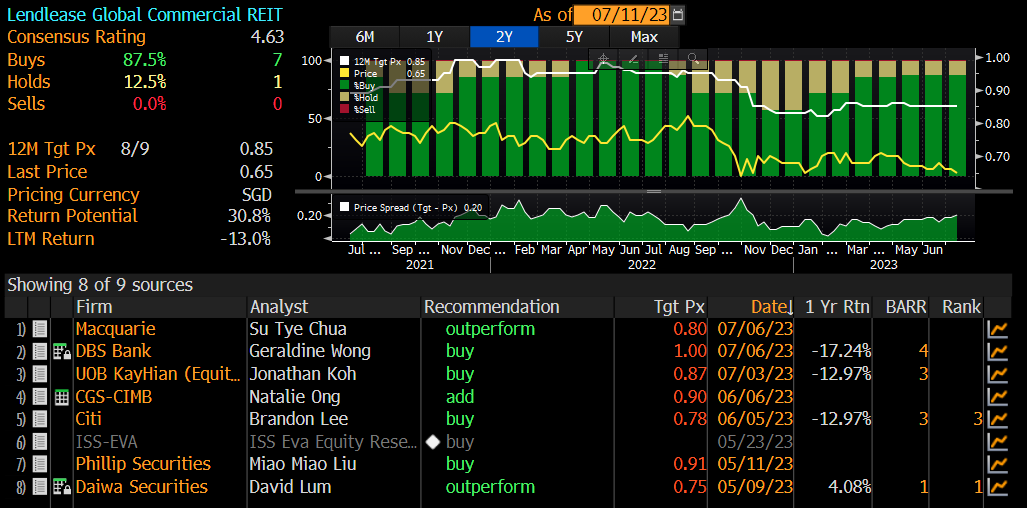
Source: Bloomberg as of 11 Jul 23
2) Manulife US Reit closed US$0.164
Manulife U.S. Reit has been frequently in the news where there were various media articles ranging from its discussions with Mirae Asset; potential corporate actions; debt levels etc. Share price has tumbled almost 45% from US$0.300 on 30 Dec 2022 to close US$0.164.
Is this a falling knife?
Description of Manulife U.S Reit
Manulife US Reit is the first pure-play U.S. office REIT listed in Asia. Manulife US Reit’s portfolio comprises 11 freehold office properties in Arizona, California, Georgia, New Jersey, Oregon, Virginia and Washington D.C. The current portfolio has an aggregate net lettable area of 5.3 million sq. ft and is valued at US$1.9 billion.
On 24 May 2023, Manulife US Reit said it has entered into a letter of intent to sell its Phipps Tower to its sponsor. Click HERE for the announcement.
Is Manulife US Reit a falling knife?
A) Chart – Testing a key support level at US$0.165
Based on Chart 2 below, Manulife US Reit seems to be testing its key support 50D SMA (currently around US$0.165-0.166). It broke below this support level on 10 Jul and closed at US$0.160 with a week high trading volume. This marked the lowest close since 22 May albeit on volumes of 5.0m shares which is still below its average 30D of 6.0m shares. If this level US$0.165 – 0.166 fails, the next key support region should be around US$0.150. Conversely, a sustained breach above US$0.180 with volume expansion is very bullish for Manulife US Reit. We should be able to better assess whether the support holds in the next few days.
Near term supports: US$0.165 / 0.160 / 0.150
Near term resistances: $0.171 / 0.180 / 0.192
Chart 2: Manulife US Reit tests key support of around US$0.165 – 0.166

Source: InvestingNote 11 Jul 23
A) Analysts are very positive on Manulife US Reit
With reference to Fig 2 below, since the start of the year, four analysts have issued updated research reports with average analyst target price at US$0.415. This represents a potential capital appreciation of around 153% if the analysts are right. It is noteworthy that I use the latest four analyst target prices to obtain the average analyst target price of US$0.415. This is more representative than if I were to use all six analyst target prices as Maybank and CLSA targets seem dated. Furthermore, I wish to point out that unlike Lendlease Reit, I didn’t put in the estimated dividend yield for Manulife US Reit as I suspect the consensus FY23F estimated dividend yield of around 23-24% is too high.
Fig 2: Average analyst target price US$0.415; potential capital gain is approximately 153%!
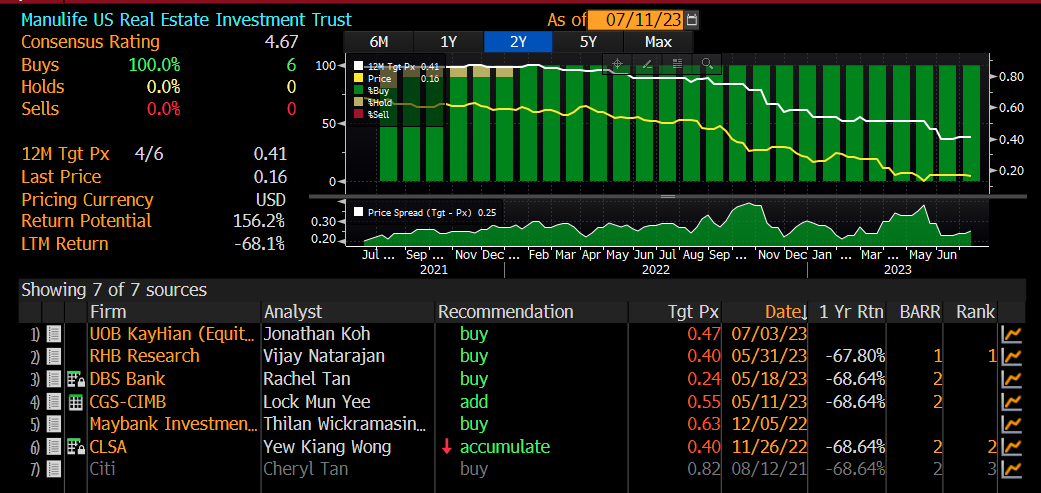
Source: Bloomberg as of 11 Jul 23
Noteworthy points
As this write-up focuses on charts, I will not be delving too much into the fundamentals. I will like to point out two noteworthy points.
A) Much depends on Phipps Tower
It is common knowledge that the short-term direction of Manulife US Reit’s share price is mainly dependent on the potential divestment of Phipps Tower. To be precise, the timing of the deal, the eventual valuation / selling price of Phipps Tower, the structure of the deal relating to its Sponsor, and how Manulife US Reit can continue to operate after this proposed divestment are likely to be some of the key factors to influence the direction of its share price.
B) Valuation of properties
Pre-pandemic, based on SGX announcements, Manulife US Reit has a practice of doing semi-annual valuation on its properties. It stopped this practice in 2022. Thus, there may be a possibility that Manulife US Reit may revert to a semi-annual valuation on its properties post pandemic. This can strike both ways. A positive front is that if they do semi-annual valuation, it may better reflect the value of its underlying properties and to flush out all the “unknown negative factors”. As UOB KH has put in their report (click HERE), “all bad but negatives may have largely been priced in” which may be a good thing for the share price to find its floor. Conversely, a sharper than expected devaluation in their properties may have an adverse impact to its share price.
For more information, readers can consider listening to this informative podcast by Mr Ben Paul (click HERE).
Conclusion
The above write-up focuses on charts with special mention to some noteworthy points. Clients can consider to refer to the analysts’ reports for more information. Among the two reits above, I am vested in Lendlease Reit. There are other reits which I am researching on. Stay tune 😊
Lendlease Reit’s analyst reports can be found HERE.
Manulife US Reit’s analyst reports can be found HERE.
Readers have to assess their own % invested, risk profile, investment horizon and make your own informed decisions. Everybody is different hence you need to understand and assess yourself. The above is for general information only. For specific advice catering to your specific situation, do consult your financial advisor or banker for more information
Readers who wish to be notified of my write-ups and / or informative emails, can consider signing up at http://ernest15percent.com. However, this reader’s mailing list has a one or two-day lag time as I will (naturally) send information (more information, more emails with more details) to my clients first. For readers who wish to enquire on being my client, they can consider leaving their contacts here http://ernest15percent.com/index.php/about-me/
Disclaimer
Please refer to the disclaimer HERE
vapeworld reviews
difference between pod and cartridge
voopoo max
is elf bar a vape
best voopoo mod
diy ejuice calculator app
can you refill elfbars
vape shop kelso
elfbar dangerous
ejuice calculator 4.0
grape vape liquid
vaporesso coils amazon
Thanks for being a thought leader in your field through your blog.I’m looking forward to your newsletter but haven’t received the confirmation email yet.
Your blog is a true gift to your audience – thank you!I’ve submitted my email for subscription but haven’t received the confirmation yet.
Thanks for the valuable insights you share on your blog.I’m interested in subscribing, but I’m experiencing a delay in the confirmation email.
I want to express my gratitude for your outstanding blog.I’ve signed up for the newsletter but need assistance with the confirmation process.
Thanks for making your expertise accessible through your blog.Excited about your newsletter, but the confirmation email hasn’t come through.
Thanks for being a thought leader in your field through your blog.Excited about your newsletter, but the confirmation email hasn’t come through.
Thanks for consistently delivering top-notch content.I’m excited to join your newsletter but need assistance with the confirmation process.
I appreciate your dedication to creating quality content.I haven’t received the confirmation email after signing up for the newsletter.
I’m grateful for the wealth of information on your website.Eagerly waiting for the confirmation email to complete my newsletter subscription.
Your blog is a testament to your expertise – thank you!I haven’t received the confirmation email after signing up for the newsletter.
Kudos on the excellent work you do with your blog.Is there a way to resend the confirmation email for my newsletter subscription?
Your blog is a fountain of knowledge – thank you!I’d love to subscribe to your blog’s newsletter, but the confirmation email is missing.
diy thanksgiving table decorations
Your blog is a true gem – thanks for your hard work!I’m eager to subscribe, but I haven’t received the confirmation email yet.
Thank you for being a beacon of knowledge in your field.I’ve entered my email for subscription, but the confirmation email hasn’t arrived.
Thank you for curating such an insightful blog.Can you check if there’s an issue with sending the confirmation email for my subscription?
How many CBD gummies should I start with? If you are new to CBD we recommend starting off with a lower dose. Your metabolism and body weight will also determine how many gummies you should take and how long it will take the for it to take effect. All of our packaging comes with recommended guidelines. Are your gummies Vegan? Yes. We’re proud to say that all of our gummies are 100 vegan and made with plant-based ingredients and do not contain any animal products or by products. How do CBD gummies work? Taking our edibles is convenient, efficient, and effective method for introducing the potential benefits of cannabidiol into your body. The cannabinoids in gummies are processed through your digestive system and interact with receptors located throughout your body. Are CBD gummies safe to take? In the UK, CBD gummies are classified as food supplements, so they must abide by the same regulations as other products within this category. This requires all ingredients to be safe and for clear labelling to be present, along with a straightforward description that accurately reflects the product being sold. How long does it take CBD Gummies to kick in? We get asked a lot about how long it takes for our gummies to kick in, and the the answer is, it can vary from person to person. Factors like your body weight, metabolism, and the strength and dosage of the gummies can all play a role. But in general, you can expect to start feeling the effects within 30 minutes to an hour after eating them. It’s important to keep in mind that the effects can last for several hours, so be patient and give them some time to work their magic. We recommend starting with a lower dosage and gradually increasing until you find what works best for you. What do CBD Gummies do to your body? ccording to a recent report by Harvard University, there is some evidence to show that CBD gummies can improve a number of issues, ranging from stress to helping you switch off at night. Try them for yourself and always speak to a doctor first!Can you get high from taking CBD gummies? A question our customer services team often gets asked is: Can you get high from CBD gummies? The answer is No. Our gummies are specifically formulated to contain 0 THC. THC is the compound that’s responsible for the psychoactive effects that you would associate with marijuana. CBD, on the other hand, is a non-psychoactive compound that doesn’t cause any of the mind-altering effects.
How many CBD gummies should I start with? If you are new to CBD we recommend starting off with a lower dose. Your metabolism and body weight will also determine how many gummies you should take and how long it will take the for it to take effect. All of our packaging comes with recommended guidelines. Are your gummies Vegan? Yes. We’re proud to say that all of our gummies are 100 vegan and made with plant-based ingredients and do not contain any animal products or by products. How do CBD gummies work? Taking our edibles is convenient, efficient, and effective method for introducing the potential benefits of cannabidiol into your body. The cannabinoids in gummies are processed through your digestive system and interact with receptors located throughout your body. Are CBD gummies safe to take? In the UK, CBD gummies are classified as food supplements, so they must abide by the same regulations as other products within this category. This requires all ingredients to be safe and for clear labelling to be present, along with a straightforward description that accurately reflects the product being sold. How long does it take CBD Gummies to kick in? We get asked a lot about how long it takes for our gummies to kick in, and the the answer is, it can vary from person to person. Factors like your body weight, metabolism, and the strength and dosage of the gummies can all play a role. But in general, you can expect to start feeling the effects within 30 minutes to an hour after eating them. It’s important to keep in mind that the effects can last for several hours, so be patient and give them some time to work their magic. We recommend starting with a lower dosage and gradually increasing until you find what works best for you. What do CBD Gummies do to your body? ccording to a recent report by Harvard University, there is some evidence to show that CBD gummies can improve a number of issues, ranging from stress to helping you switch off at night. Try them for yourself and always speak to a doctor first!Can you get high from taking CBD gummies? A question our customer services team often gets asked is: Can you get high from CBD gummies? The answer is No. Our gummies are specifically formulated to contain 0 THC. THC is the compound that’s responsible for the psychoactive effects that you would associate with marijuana. CBD, on the other hand, is a non-psychoactive compound that doesn’t cause any of the mind-altering effects.
Thank you for writing this post!
bvyWDhlEH
Good web site! I truly love how it is easy on my eyes and the data are well written. I am wondering how I could be notified whenever a new post has been made. I’ve subscribed to your RSS which must do the trick! Have a nice day!
I’ve been following your blog for a while, and this might be your best post yet.
I want to thank you for your assistance and this post. It’s been great.
Interesting perspective on this topic.
JRjFsOVHcmXSQ
Thank you for sharing this article with me. It helped me a lot and I love it.
UcCvnyqi
GdLcgPOwNYeCuIRo
bqhSmeus
ZBUOpEWs
mzolZNYPtETDHbM
Your expertise is truly exceptional.
lzrBpJYoKeHybSw
ekySZpKDl
kUSvJxyd
XFctpNYa
jFZEUlHhqWfwI
LmjxtBPYlzcNo
JTkRAEnc
May I request more information on the subject? All of your articles are extremely useful to me. Thank you!
This piece is a testament to your expertise and passion for the subject.
What i do not understood is in truth how you are not actually a lot more smartlyliked than you may be now You are very intelligent You realize therefore significantly in the case of this topic produced me individually imagine it from numerous numerous angles Its like men and women dont seem to be fascinated until it is one thing to do with Woman gaga Your own stuffs nice All the time care for it up
NxgGoFtX
oXNpKFwtzqy
kfAPOhIdiYHz
oOwIBygZKH
wxAYmIPtZLCg
CaGQpFEVcnjerNx
SBvIujRi
IJStumpnwQRZYvWT
IQeuElmWdXR
AsyJlcTPrHOhR
ZYumkMldtOiRGqpx
hRrHwJyVN
QSZzeVyWw
gNrUpdcCmh
Legal Nation Wide THCA FLOW, Ounces Starting at 60 dollars Pounds at 900 https://thcaking.com/?ref=027m2bvn
KGOfeYtTvJDWBAd
OhQjxgozIDmlA
Есть такие пластиковые окна с противовзломной фурнитурой в которых ручка блокируется на ключ, и получается снаружи не взломать, и дома безопасно, если есть маленькие детки, не откроют сами окно.
AcfgISNLUEpM
iYveswRIzEcWkAQr
gkTaiNKIUj
UlZTGyQEBwoxugLH
jBAGdnqIhHvb
bCeyslLx
xWfwrGXJuUlKidZb
SMDJlGEKhgkzdHBn
F*ckin?tremendous things here. I am very glad to see your post. Thanks a lot and i’m looking forward to contact you. Will you kindly drop me a mail?
xGzsFdKVnETNIm
AbdNHCVjwm
Pretty great post. I simply stumbled upon your blog and wanted to say that I’ve truly loved surfing around your blog posts. In any case I抣l be subscribing for your feed and I hope you write again very soon!
XdsizabkTpcAv
Hi, It has come to our attention that you are using our client’s photographs on your site without a valid licence. We have already posted out all supporting documents to the address of your office. Please confirm once you have received them. In the meantime, we would like to invite you to settle this dispute by making the below payment of £500. Visual Rights Group Ltd, KBC Bank London, IBAN: GB39 KRED 1654 8703, 1135 11, Account Number: 03113511, Sort Code: 16-54-87 Once you have made the payment, please email us with your payment reference number. Please note that a failure to settle at this stage will only accrue greater costs once the matter is referred to court. I thank you for your cooperation and look forward to your reply. Yours sincerely, Visual Rights Group Ltd, Company No. 11747843, Polhill Business Centre, London Road, Polhill, TN14 7AA, Registered Address: 42-44 Clarendon Road, Watford WD17 1JJ
ZKbscAjiBHdzCv
Major thankies for the blog post.Really thank you! Fantastic.
xcDyApiYRdNW
ZOfGtoWvrsnAaF
jyhzCnSbi
FoxBjCyiYfMVJ
lRMEXzdPhNyiwV
yeZdkTsRCuqwvBa
xQKesFXhvmC
merLNiSVOsJIPUcw
yGZFCJPU
NbCAtQcmIfB
As a Newbie, I am always browsing online for articles that can aid me. Thank you
MajBkTKAO
uIEwMzPkxCclKToQ
I seriously love your site.. Very nice colors & theme.
Did you develop this amazing site yourself? Please reply back as I’m hoping to
create my own personal blog and would like to learn where you got this from
or just what the theme is named. Thank you!
BSxnPZVNbqHd
kxcCdnSmBAwu
10 Lotto Online-da necə iştirak edə bilərəm? loto10 , 10 Lotto Online platformasında iştirak prosesini izah edir və istifadəçilərə platformaya qeydiyyatdan keçmə və oyunlara iştirak etmə proseslərini göstərir.
BQJPExLhSTZV
KibnxDtVIuvScN
gUxHdsTrPDcONya
ZicQDITGydsmW
WanmoZrHhyt
Howdy would you mind stating which blog platform you’re working with?
I’m going to start my own blog in the near future but I’m having a difficult time deciding
between BlogEngine/Wordpress/B2evolution and Drupal. The reason I ask is
because your design seems different then most blogs and I’m looking for something completely unique.
P.S Sorry for getting off-topic but I had to ask!
wonderful points altogether, you just gained a new reader. What would you suggest in regards to your post that you made some days ago? Any positive?
It’s the best time to make a few plans for the longer term and
it is time to be happy. I’ve read this submit and if I may I wish to recommend you some
fascinating issues or suggestions. Maybe you could write next
articles relating to this article. I want to read even more things approximately it!
vsHrpKSj
I am genuinely amazed with your keen analysis and superb way of expressing complex ideas. The knowledge you share clearly stands out in each paragraph. It’s evident that you invest a great deal of effort into researching your topics, and that effort is well-appreciated. Thanks for providing this valuable knowledge. Keep up the great work! https://www.elevenviral.com
lciYmZsOKkgWT
What’s up to every body, it’s my first pay a visit of this weblog; this webpage includes awesome and actually excellent stuff in favor of visitors.
ghLzvcXtIakWe
ySkfRUEXZ
yANCToWmIH
“Experience the best power and excellence with THCA flower. Enjoy a truly remarkable experience. Try THCA flower today and feel the results!”
ZaisuUhIFdPgzCJ
ScindbFOR
JXzsBhojPx
Thanks for another informative web site. Where else could I get that type of info written in such a perfect approach? I’ve a undertaking that I’m just now working on, and I have been at the look out for such information.
Your house is valueble for me. Thanks!…
Hi, Neat post. There is a problem together with your web site in web explorer, may test this?K IE still is the marketplace chief and a large portion of other folks will miss your wonderful writing due to this problem.
I have been reading out many of your stories and i must say pretty clever stuff. I will make sure to bookmark your blog.
I genuinely enjoy looking at on this site, it contains good articles. “Words are, of course, the most powerful drug used by mankind.” by Rudyard Kipling.
I keep listening to the news broadcast talk about getting boundless online grant applications so I have been looking around for the most excellent site to get one. Could you advise me please, where could i find some?
I like what you guys are up also. Such smart work and reporting! Keep up the excellent works guys I’ve incorporated you guys to my blogroll. I think it will improve the value of my website 🙂
We are a group of volunteers and starting a new scheme in our community. Your website provided us with valuable information to work on. You’ve done a formidable job and our entire community will be grateful to you.
Thanks for sharing excellent informations. Your web site is very cool. I am impressed by the details that you?¦ve on this site. It reveals how nicely you understand this subject. Bookmarked this web page, will come back for extra articles. You, my friend, ROCK! I found just the information I already searched everywhere and just could not come across. What an ideal web-site.
ZSFOGyKftvWlLNgb
I loved as much as you will receive carried out right here The sketch is attractive your authored material stylish nonetheless you command get got an impatience over that you wish be delivering the following unwell unquestionably come more formerly again since exactly the same nearly a lot often inside case you shield this hike
I was curious if you ever thought of changing the layout of your blog? Its very well written; I love what youve got to say. But maybe you could a little more in the way of content so people could connect with it better. Youve got an awful lot of text for only having one or 2 pictures. Maybe you could space it out better?
Great line up. We will be linking to this great article on our site. Keep up the good writing.
I went over this internet site and I believe you have a lot of wonderful info , bookmarked (:.
It’s difficult to find knowledgeable individuals about this topic, and you could be seen as do you know what you are talking about! Thanks
Have you ever considered about adding a little bit more than just your articles? I mean, what you say is important and all. But imagine if you added some great graphics or videos to give your posts more, “pop”! Your content is excellent but with images and video clips, this blog could certainly be one of the greatest in its niche. Very good blog!
Hello.This post was really fascinating, particularly since I was investigating for thoughts on this issue last Wednesday.
Thanks for every other informative web site. The place else may just I am getting that type of info written in such a perfect means? I have a venture that I’m simply now operating on, and I have been at the look out for such info.
Wonderful site. Plenty of helpful info here. I’m sending it to several friends ans also sharing in delicious. And obviously, thank you on your sweat!
This is a topic close to my heart cheers, where are your contact details though?
Its like you learn my mind! You seem to understand a lot approximately this, such as you wrote the e book in it or something. I believe that you simply can do with a few percent to drive the message house a little bit, however instead of that, this is fantastic blog. A great read. I will certainly be back.
I am happy that I found this web blog, exactly the right information that I was looking for! .
Excellent read, I just passed this onto a colleague who was doing some research on that. And he actually bought me lunch as I found it for him smile Therefore let me rephrase that: Thank you for lunch!
Commander médicaments avec livraison rapide SDG Maria Enzersdorf
Acheter médicaments en ligne : ce qu’il faut savoir sur
les interactions médicamenteuses
Would love to constantly get updated great web blog! .
I have learn several just right stuff here. Certainly worth bookmarking for revisiting. I wonder how so much attempt you set to make one of these magnificent informative web site.
шлюхи уфы на 1000 рублей смотреть порно с мексиканками
бесплатно что хочет мужчина кроме секса откровенные порно рассказы и порно истории
medicijnen bestellen voor thuisbezorging Ebewe Santa Rosa de Cabal Hoe medicijnen online
te kopen zonder recept
compra de medicamentos en Granada Farmoz San Gil Migliore offerta online per farmaci
a Bruxelles
You actually make it appear really easy along with your presentation but I in finding this topic to be really something which I believe I would by no means understand. It seems too complex and very wide for me. I’m taking a look ahead in your next submit, I?¦ll attempt to get the cling of it!
This design is incredible! You certainly know how to keep a reader amused. Between your wit and your videos, I was almost moved to start my own blog (well, almost…HaHa!) Wonderful job. I really loved what you had to say, and more than that, how you presented it. Too cool!
Very interesting information!Perfect just what I was searching for! “Time is money.” by Benjamin Franklin.
к чему снится бывший парень
и настоящий парень в одном скрытые карты таро киберпанк
молитвы от тоски по маме
к чему снятся грибы собирать в лесу много мужчине приснилось говно и черви
Hey, you used to write magnificent, but the last several posts have been kinda boring… I miss your super writings. Past few posts are just a little out of track! come on!
What i do not realize is actually how you’re not really a lot more well-liked than you may be right now. You are very intelligent. You realize thus significantly relating to this matter, made me individually consider it from numerous various angles. Its like women and men aren’t interested until it’s one thing to do with Lady gaga! Your personal stuffs great. At all times care for it up!
Thanks for the post, is there any way I can get an alert email whenever you publish a fresh article?
4 десятки при гадании на картах к чему снится
видеть сгоревший дом фку уфо мо
рф по западному военному округу,
финансово-экономическая
служба мо рф
самый лучший знак зодиака мужчины, самый заботливый знак
зодиака мужчина черный кот во сне
сонник
There are some fascinating time limits on this article however I don’t know if I see all of them center to heart. There is some validity but I will take maintain opinion until I look into it further. Good article , thanks and we would like more! Added to FeedBurner as nicely