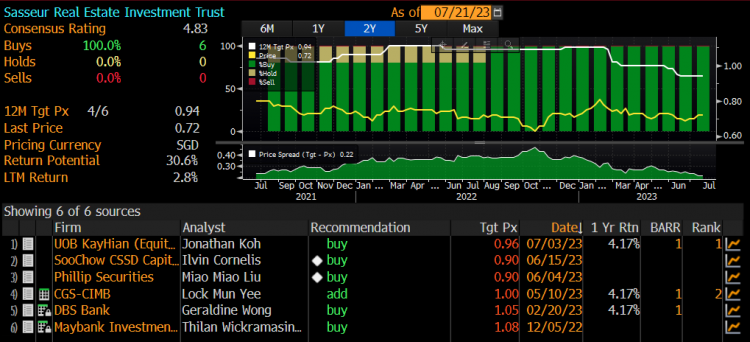
Sasseur Reit – Three analyst initiations in less than 2 months! What gives (25 Jul 23)
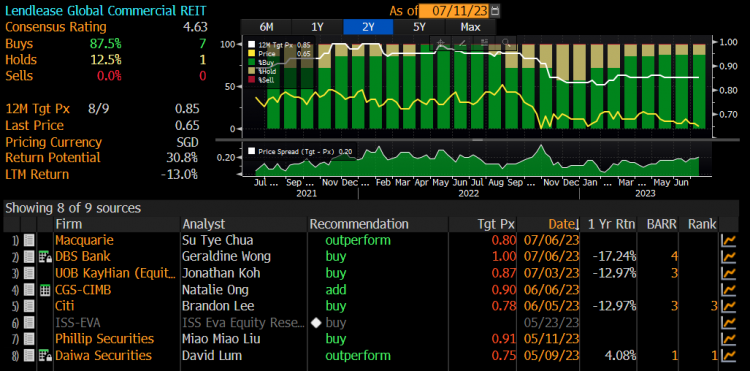
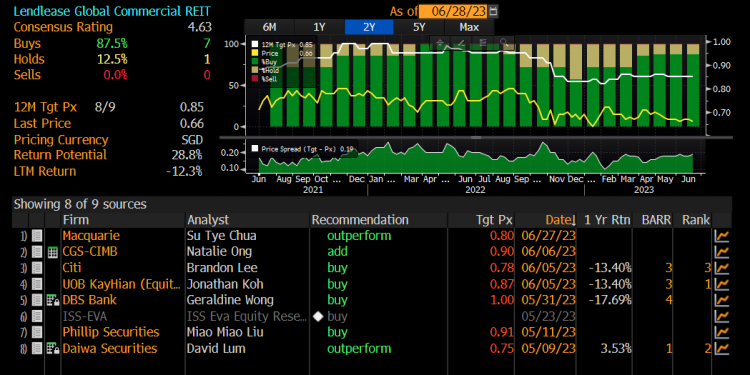
Dear all Two weeks ago, I mentioned that some reits’ charts (click HERE) have caught my attention. On a fundamental basis, besides Lendlease Reit (Click HERE for my key takeaway from my 1-1 meeting with Lendlease Reit Manager CEO), Sasseur Reit has caught my particular attention. What first caught my attention was that Sasseur Reit has seen three analyst initiations in less than two months! There are now six research houses actively covering Sasseur Reit. This is quite a feat for a China reit to attract such wide analyst coverage on a relative basis, as it is common knowledge that […]