Dear all
First of all, apologies for the hiatus in posting new market outlook on my blog. I have been extremely busy for the past three months. My clients can attest to how busy I have been. I have been sending out my market views and news even on weekends and on public holidays. 😊
With reference to my previous writeup published on 26 Feb 2023 (click HERE), I mentioned that I planned to pare positions so that I can accumulate on weakness. In retrospect, it was a timely call. I was fortunate that I have pared my positions so that I have the ability to accumulate amid the slump in our markets in March amid the U.S regional bank crisis. I have since traded in and out several times since then.
Nasdaq and S&P500 have hit the highest since Apr 2022 and Aug 2022 with year-to-date (“YTD”) gains of around 26.5% and 11.5% respectively (Refer to Table 1 below). However, Hang Seng and STI underperformed with YTD losses of around 4.2% and 2.6% respectively.
Table 1: YTD performance of the indices

*Source: InvestingNote 2 Jun 23; STI was closed on 2 Jun.
What should we do in this bifurcated market? Should we buy, hold or sell?
Below is a sample of my market observation and my personal market view which I typically send to my clients on a regular basis. Readers who are interested can consider signing HERE. However, this reader’s mailing list has a one or two-day lag time as I will (naturally) send information (more information, more emails with more details) to my clients first. For readers who wish to enquire on being my client, they can consider leaving their contacts HERE.
Personal view – Continue to sell into strength and accumulate on dips
As I am short term in nature and I am currently cautious in the market for the next one month, I have already sold into strength for the past several weeks and will continue to do so. Meanwhile, I am preparing to accumulate on battered down stocks with sound long term fundamentals and strong balance sheets.
First things first, why am I cautious in the overall markets?
A) Lack of potential catalysts to push it higher
Firstly, the results season is typically a catalyst to push the share price higher or lower. However, most U.S., Chinese and Singapore companies have largely released their quarterly results. Thus, there is one less catalyst.
Secondly, for Singapore, school holidays have started where parents may take leave to go family vacations. In addition, the U.S. summer holidays typically commence from either late June to early September, or late May to mid-August. In addition, summer vacation typically spans 8-9 weeks in the US. Therefore, it is reasonable to expect less trading activity at least in June.
Thirdly, most Singapore companies have already ex dividend in April and May. The next dividend season is likely to be around mid-July to end August period. Hence from now to at least till mid-July, there is one less reason to own stocks.
B) Narrow breadth in the market
Based on Chart 1 below, citing data from Seeking Alpha as of 19 May, S&P500 clocked a 9.2% gain whereas the equal weighted S&P500 (where every stock in the index has equal weight regardless of the market cap) registered a 0.9% rise.
Although this phenomenon (narrow breadth) has been on-going for some time and may continue, suffice to say that this is not a confidence booster. For the market to continue its rally, it is good to see most stocks participate in the rally.
Chart 1: S&P500 vs equal weighted S&P500
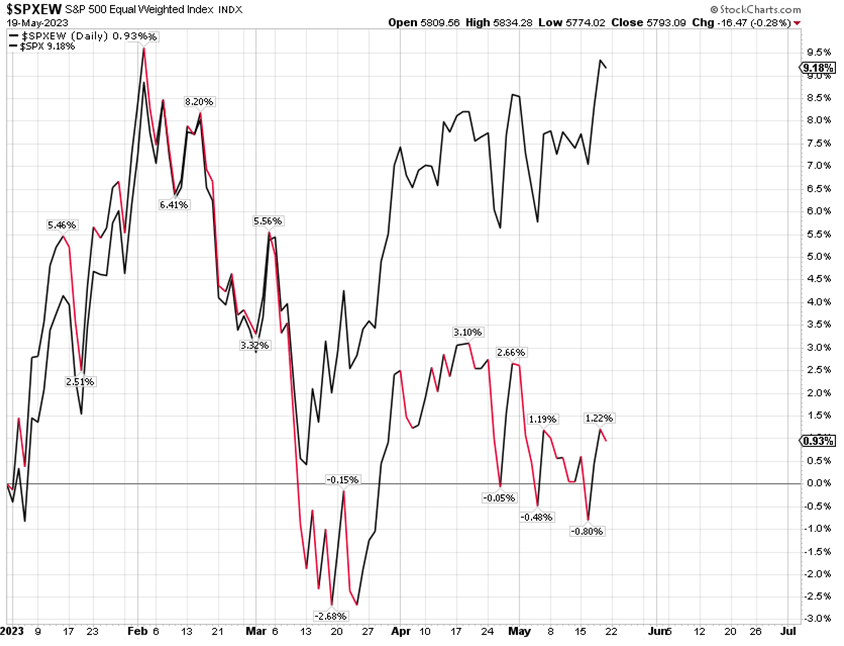
Source: Seeking Alpha 19 May
C) Amid the lack of catalysts, headwinds or risk factors continue to exist
Notwithstanding the lack of catalysts, certain headwinds or risk factors continue to exist.
Firstly, various geopolitical concerns (either China vs U.S.; China vs Taiwan) continue to persist. On 21 May, China announced that it will block its operators of key infrastructure from buying from Micron, its first major move against a US chip. On 8 Apr, 71 Chinese military aircraft crossed the sensitive median line of the Taiwan Strait. This is in response to President Tsai Ing-wen’s meeting with the speaker of the U.S. House of Representatives. In early Feb, Taiwan’s internet infrastructure was damaged after two undersea cables were severed by Chinese ships in separate incidents. Suffice to say that relationships between these countries continue to be tense.
Secondly, valuations are not cheap, especially in the U.S. markets. Based on Bloomberg as of the close of 31 May, S&P500 trades at 20.1x PE and 4.1x P/BV compared to its 5-year average 21.9x PE and 3.9x P/BV respectively.
Thirdly, U.S. economy is expected to weaken going into second half of 2023. Consequently, companies’ results may face margin pressures amid possibly weakening revenue. Although consumer demand and U.S. jobs market are still generally resilient, it remains to be seen whether both areas can maintain their strength going into 2HFY23.
D) What is next if we plan to accumulate on weakness, or top slice some of our positions?
In line with my usual practice of compiling SGX stocks sorted by total potential return at the start of the month, readers who wish to receive my manual compilation of stocks sorted by total potential return can leave their contacts HERE. I typically send the list out to readers around the first week of the month, if time permits. (I definitely send out to my clients on a monthly basis)
With this list, it may be a good first level screening to decide which stocks to sell into strength, or add positions on weakness, or rebalance your portfolios. Nevertheless, please refer to all the important notes (e.g. criteria and noteworthy points) in the list to ensure you are aware of the limitations of such screens.
I have generated two tables below and have appended the top 10 and bottom 10 stocks for readers. Table 2 lists the top 10 stocks sorted by highest total potential return. These top 10 stocks offer a total potential return of between 50 – 138%, based on the closing prices as of 31 May 2023. Most importantly, please refer to the criteria and caveats below. [My clients have already received the entire list of my compilation of 90 stocks and some highlighted stocks.]
Table 2: Top 10 stocks sorted by total potential return

Source: Bloomberg 31 May 2023
Table 3 lists the bottom 10 stocks sorted by total potential return. These bottom 10 stocks offer a total potential return of around -38% to +9%, based on the closing prices as of 31 May 2023.
Table 3: Bottom 10 stocks sorted by total potential return

Source: Bloomberg 31 May 2023
E) *Caveat: Do note that everybody is different*
Importantly, do note that the above is based on my personal view premised on my personal portfolio, risk profile, investment horizon and strategy. It may, or may not be suitable to you as everybody is different. Hence it is good to incorporate my general market views with your own due diligence, and taking into account of your percentage invested, risk profile, investment horizon and make your own informed decisions. Everybody is different hence you need to understand and assess yourself. The above is for general information only. For specific advice catering to your specific situation, do consult your financial advisor or banker for more information
Disclaimer
Please refer to the disclaimer HERE.
I don’t even know how I ended up here, but I thought this post was good. I do not know who you are but certainly you’re going to a famous blogger if you are not already 😉 Cheers!
rIxCmfUEdOjJpis
mzXHatbCsYNhug
Much respect for covering this subject. Do you plan to go into additional depth?
Wow that was unusual. I just wrote an really long comment but after I clicked submit my comment
didn’t show up. Grrrr… well I’m not writing all that over again. Regardless, just wanted to say fantastic blog!
I’d always want to be update on new posts on this site, saved to bookmarks!
Wonderful post however I was wanting to know if
you could write a litte more on this topic?
I’d be very thankful if you could elaborate a little bit further.
Thank you!
dPZLzcutWTJEb
InAbBtqDm
OKrIxVtWQC
My brother suggested I would possibly like this web site.
He used to be entirely right. This put up truly made my day.
You can not imagine just how much time I had spent for this
info! Thank you!
It’s actually very difficult in this active life to listen news on Television, therefore I only use internet for that reason, and take the newest news.