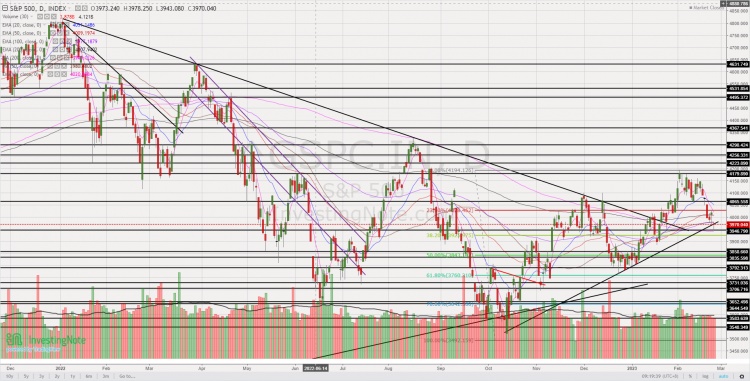
Chart 1_S&P500 chart 26 Feb 23

U.S & European stocks logged their largest weekly falls for 2023. What’s next for the equity markets? (26 Feb 23)

Dear all With reference to my writeup published on 30 Jan 2023 (click HERE), where I mentioned I would be cautious in the overall markets, especially after a sharp run up, US stocks have dropped consecutively for the in the past three weeks. Dow has fallen consecutively for the past three weeks and logged its sharpest 1,010 points or 3.0% last week.   So, what is next for our markets? Do we buy, hold or sell? Just to highlight, the below is a sample of a brief stock alert or / and observation which I typically send to my clients […]

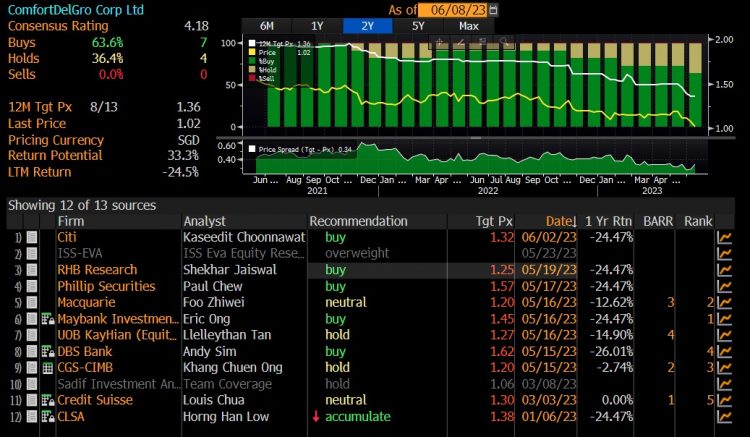
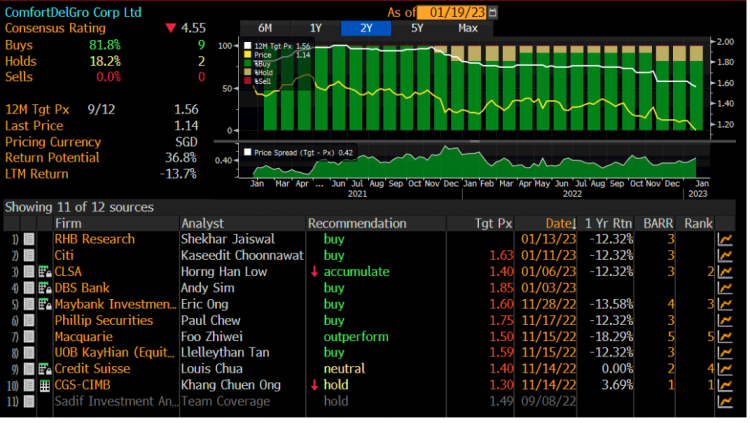
Figure 1_Comfort Delgro analyst target price 19 Jan 23

Comfort Delgro sinks to 14-year low! Will it go lower? (19 Jan 2023)

Dear all On 11 Jan, Comfort (CD) closed at $1.21, the lowest close since 31 Oct 2008. The next day, to the horror of CD’s shareholders, it broke $1.21 with volume expansion and closed at $1.18. At the time of this write-up, CD closed today at $1.14, the lowest close last seen 29 Oct 2008. Will CD fall more? Or will this be a comfortable trade at current level? Let’s read on for more.   Possible reasons to be bullish A) Still a recovery play CD with its operations in Australia, China, Singapore, UK etc. should gradually benefit as economies […]

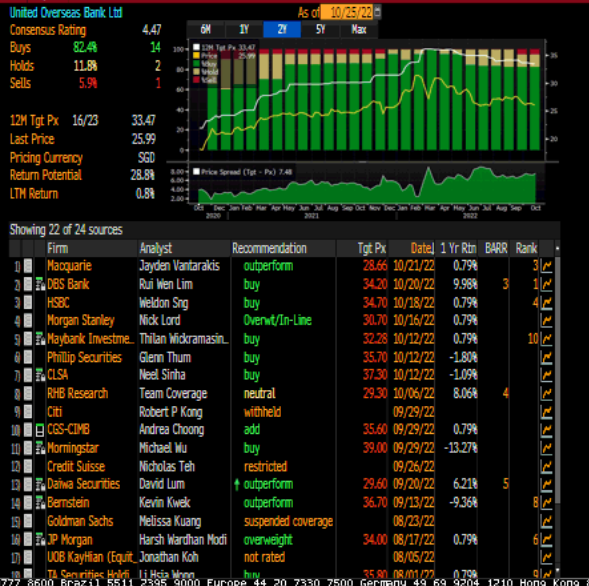
Figure 1_UOB analyst target price 25 Oct 22

Dow seems to have formed a bullish double bottom formation (25 Oct 2022)

Dear all Talk to anyone and I guess at least 50% of them are shaking their heads. Some of their usual concerns are a) Anxieties on the economy and their jobs in 2023; b) Hit by inflationary pressures from rising costs ranging from food, fuel, electricity, cars and properties; c) Worries over their home mortgage as rates are soaring through the roof; d) Concerns on their portfolios whether there may be more losses ahead and etc… At the point of writing this article, Hang Seng closed -1,030 points lower, or -6.4% to close 15,181. Is it all doom and gloom? […]

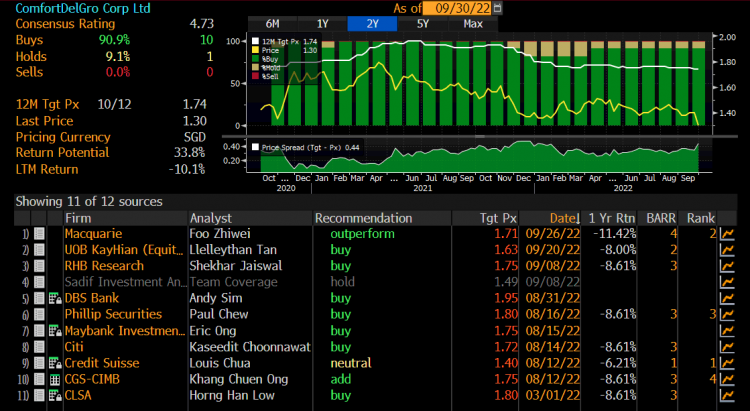
Figure 1_Comfort Delgro analyst target price 30 Sep 22

Comfort Delgro drops back to pandemic lows! What gives? (30 Sep 22)

On 1 Sep, it was announced that Comfort Delgro (“CD”) will drop out of STI after being first included in the STI on 28 Jul 2010. Subsequently, there was turmoil in United Kingdom (“UK”) gilts and currency as UK government led by Prime Minister Liz Truss unveiled a (surprisingly) GBP45b plan to reduce taxes (click HERE for more information). Although CD may see some near-term price weakness, at Friday’s close of $1.32 (CD touched an intraday low $1.29 at the point of writing this), I personally believe most of the negatives may have already been priced in. Why am I […]

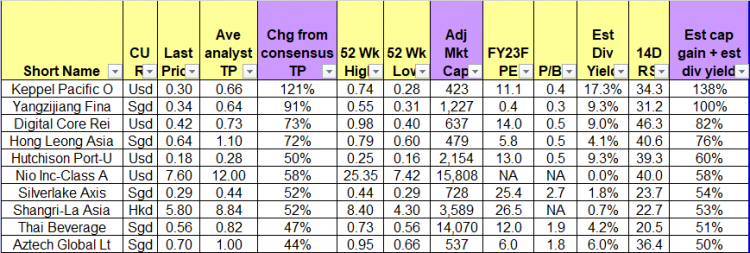
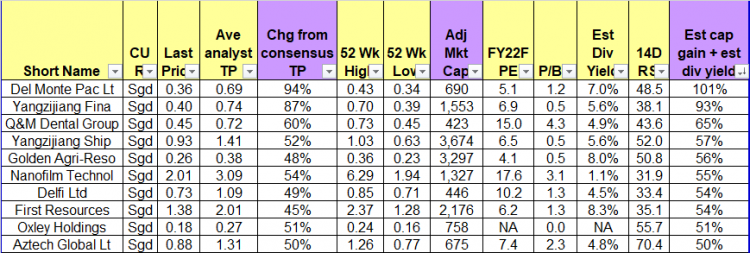
Table 1_Top ten stocks sorted by total potential return 31 Aug 22

Sep – Historically a weak month for equities. Buy, hold or sell? (6 Sep 2022)

Dear all, After touching an intraday high 4,325 on 16 Aug 22, S&P500 has slid 401 points, or -9.3% to 3,924 on 2 Sep. Hang Seng has slid to around 19,144 at the time of writing. Given the market pullback, there are several interesting stocks worthy of research. Coupled with various macro events happening this month (e.g. ECB & Fed Chair Powell Speaks 8 Sep; U.S CPI 13 Sep and FOMC 22 Sep etc.), I have to plan my trading strategy. Give the above, time is tight and this will be just be a brief article to update readers. (As […]

Table 1_Top ten stocks sorted by total potential return 29 Jul 22

Numerous trading opportunities as Singapore corporates report results (9 Aug 2022)

Dear all, Happy National Day! How has your portfolio been year to date? With reference to my writeup published on 3 Jul 2022 (click HERE), I mentioned that there are likely to be opportunities in the next few weeks. Post my writeup, S&P500 touched an intraday low of 3,722 on 14 Jul before closing up 418 points or 11.2% at 4,140 yesterday. In fact, S&P500 posted its best monthly gain in July, since Nov 2020. STI touched an intraday low of 3,088 on 15 Jul before trading up 183 points or 5.9% at 3,271 yesterday. Our Singapore banks started to […]

Table 1_Top ten stocks sorted by total potential return 30 Jun 22

Markets – market opportunities may materialise in the next few weeks (3 Jul 2022)

Dear all, I have been extremely busy with work. In my line of work (i.e., stock broking), we may have numerous trading ideas but we always face severe time constraints every day. My clients can attest to the numerous messages and information which I send out daily (Nevertheless, I do remind clients to exercise their due diligence on such information which I send as they are general in nature and may not be suitable to one’s specific risk profile etc.) For my readers, thanks for the patience and for viewing my blog which unfortunately, is not updated as frequently as […]

GSS Energy chart 24 Sep 21

GSS Energy looks interesting; key level for potential bullish breakout is at $0.075 (27 Sep 2021)

Dear all Of late, GSS Energy (“GSS”) has caught my attention. It has dipped from an intraday high of $0.083 on 17 Sep 2021 and has weakened to $0.072 on 24 Sep 2021. This weakness may be attributed to profit taking and contra players exiting or rolling their positions. 24 Sep is T+5 of its high-volume day on 17 Sep. My personal guess is that most of the contra players may have already exited (i.e., selling may have been largely exhausted). It may be time to relook into GSS Energy. Let’s take a look.   Basis a) E mobility business […]

Chart 1_SPX 10Y PEBD

Markets are “bubblish”, or aren’t they? (5 Apr 2021)

Dear all Markets have been on a tear for the past five months. Since my write-up published on 1 Nov 2020, citing opportunities in our Singapore market (click HERE for the write-up), STI has soared 786 points, or 32.4% from 2,424 on 30 Oct 2020 to close 3,210 on 5 Apr 2021 (intra-day high today was 3,212). At the time of writing this, S&P500 futures are trading at 4,040, translating to around 24% gain over the same period. In fact, STI is the 2nd best performing market for 1Q2021 amongst 18 global benchmarks. Are markets in the midst of a […]

WhatsApp Image 2020-06-23 at 11.44.11

Chart alert! Yoma may breach $0.280 in the near term (23 Jun 2020)

This week, Yoma catches my attention on a spike in share price, accompanied with an expansion in volume. Let’s take a look.   Chart analysis Yoma’s chart has been on a short-term uptrend since 24 Mar. ADX last trades 22.2, amid positively placed Dis, indicative of a trend. Its short term exponential moving averages (“EMA”) are rising steadily and its long term moving averages (namely 200D EMA and 200D SMA) are plateauing. Indicators such as OBV and RSI are strengthening. Volume has picked up significantly today and yesterday which may signify good odds of breaching its key resistance $0.275 – […]