Alibaba trades at single digit forward PE; net cash with earnings growth. What gives?! (11 Oct 23)

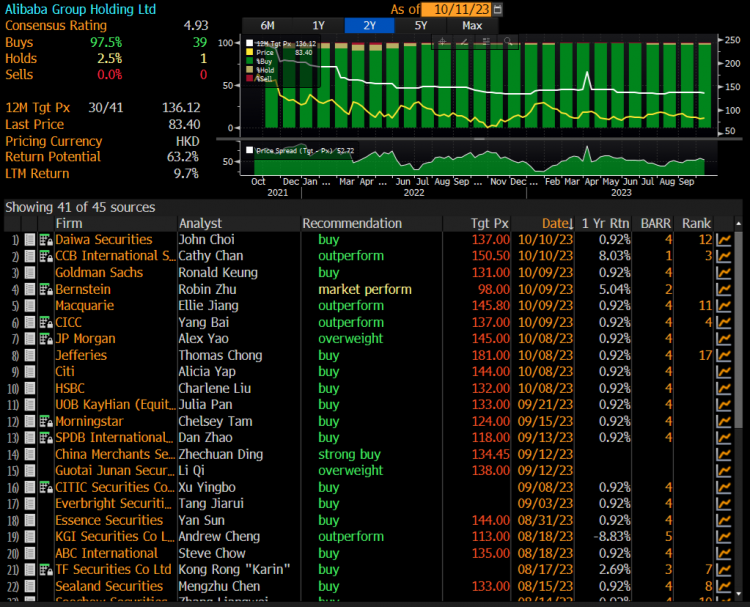
Dear all Alibaba, since hitting a post-result intraday high of HKD97.95 on 11 Aug, it has slumped 14.9% to close HKD83.40 on 10 Oct. At HKD83.40, Alibaba trades at 9.3x FY24F and 8.5x FY25F PE. Its financial year ends in Mar. On 26 Sep, Alibaba submitted a spin-off proposal for its Cainiao (click HERE) to the Hong Kong Stock Exchange and the Hong Kong Stock Exchange has confirmed that the Company may proceed with the Proposed Spin-off. A spin-off listing application has been submitted to the Hong Kong Stock Exchange. All in, it looks pretty positive. Why is Alibaba trading […]
Dow seems to have formed a bullish double bottom formation (25 Oct 2022)

Dear all Talk to anyone and I guess at least 50% of them are shaking their heads. Some of their usual concerns are a) Anxieties on the economy and their jobs in 2023; b) Hit by inflationary pressures from rising costs ranging from food, fuel, electricity, cars and properties; c) Worries over their home mortgage as rates are soaring through the roof; d) Concerns on their portfolios whether there may be more losses ahead and etc… At the point of writing this article, Hang Seng closed -1,030 points lower, or -6.4% to close 15,181. Is it all doom and gloom? […]

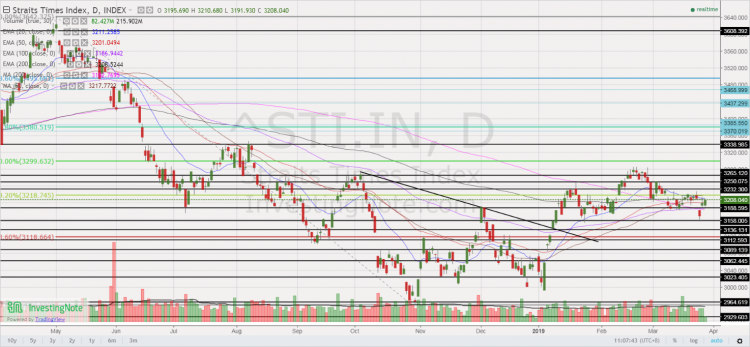
S&P500 logged its largest one day fall since Jan. Buy more, or head to the exit? (27 Mar 2019)

Dear readers, Last Fri, S&P500 logged its largest one day fall since 3 Jan 2019, due in part to the weak European PMI and the yield curve inversion between U.S. 3-month bill and 10-year note yields. At the time of writing this, Dow closed 0.55% higher on Tues as U.S. 10 year bond yields stabilise. Is last Fri’s fall the precursor to something more serious? Or it is a false alarm?   First things first, what are the reasons for the sharp rally since late Dec? S&P500 has rallied approximately 20.1%, or 471 points from the intra-day low of 2,347 […]

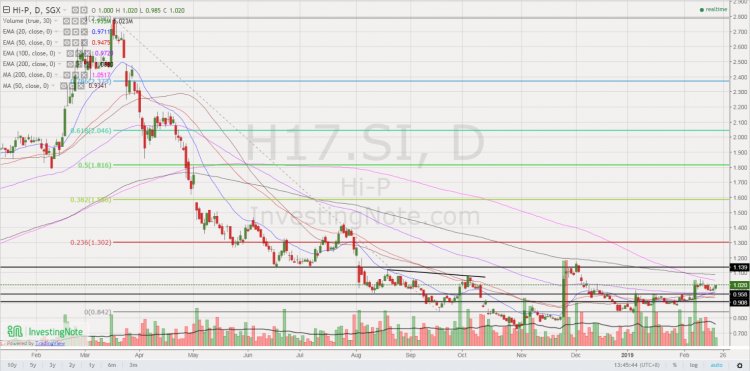
Hi-P – Chart looks interesting with rising ADX, amid positively placed DI (21 Feb 19)

This week, Hi-P caught my attention due to its chart. It last trades at $0.990. Day range 0.985 – 1.00. Let’s take a look. Basis below 1.Chart looks interesting with rising ADX, amid positively placed DI Hi-P has been trading in a tight range $0.885 – 0.960 since 8 Jan 2019 and broke out with strong volume on 11 Feb 2019. ADX has been rising to trade 31.6 amid positively placed DI, indicative of a trend. RSI last trades 57.9. Today is T+8 of 11 Feb upmove. There has been some price weakness on 15 & 18 Feb as I […]

ISOTeam trades near 4 year low despite record order books and bright outlook (10 Jan 19)

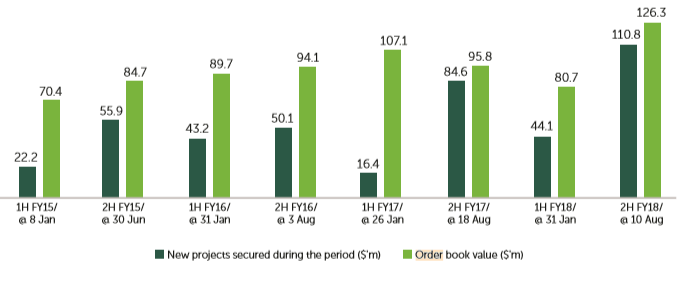
ISOTeam (“ISO”) caught my attention. Despite sitting on a record order book, ISO has tumbled approximately 44% from an intra-day high of $0.385 on 10 Apr 2018 to close near a four year low at around $0.215 on 10 Jan 2019. The share price decline was attributable in part to its 4QFY18 surprise loss announced in Aug 2018 (financial year ends in Jun). Nevertheless, my gut feel is that 4QFY18 should mark the trough in earnings and results should improve on a quarter on quarter basis in the next few quarters. As this company is a potential turnaround play, I […]