Dear readers,
Last Fri, S&P500 logged its largest one day fall since 3 Jan 2019, due in part to the weak European PMI and the yield curve inversion between U.S. 3-month bill and 10-year note yields.
At the time of writing this, Dow closed 0.55% higher on Tues as U.S. 10 year bond yields stabilise. Is last Fri’s fall the precursor to something more serious? Or it is a false alarm?
First things first, what are the reasons for the sharp rally since late Dec?
S&P500 has rallied approximately 20.1%, or 471 points from the intra-day low of 2,347 on 26 Dec 2018 to close 2,818 on 26 Mar 2019. This sharp rally may be attributed to some of the following factors
a) Fed Chair Jerome Powell said on 4 Jan 2019 that he would be flexible / patient on interest rate. i.e. dovish;
b) Most U.S. corporate results announced in Jan – Feb were not as bad as feared;
c) Hopes of a resolution of U.S. / China trade war;
d) Some idle cash / funds were not invested yet and they were waiting to invest into the market at the start of the year;
e) Equity market valuations have become more palatable after the sell-off in Dec 2018.
May be time for caution now…
a) Fed Chair Jerome Powell has surprised the market on his dovishness last week. In my opinion, it seems extremely difficult to surprise the market with even more dovishness in the near term. i.e. This share price driver may have lost its efficacy in the near term;
b) U.S. and China trade talks have grabbed the headline news for months. Suffice to say that much of the optimism (excluding an excellent deal between U.S. and China, coupled with the out right abolishment of existing tariffs) may have been factored into the market;
c) Slowing global economy. For example, European PMI data released last week was weaker than expected. This may be why European Central Bank (“ECB”) postponed its next post-rate increase until 2020 at the earliest and offer fresh loans to the banks;
d) U.S. economic data (some data were delayed) may not be strong in the next couple of months due to the knock on effects of the partial government shutdown and the slowdown in the global economy;
e) In the coming weeks, we shall know how U.S. corporates fare in 1QFY19F and their guidance for 2Q. Samsung Electronics just warned on Tuesday that 1QFY19 financial results will be lower than market estimates. This is unlikely to be an isolated case due to the slowdown in Europe, China, business cycle etc.
f) Political problems in the U.S. Although the Mueller report has not found any evidence pointing to Donald Trump colluding with Russia, it is less clear cut on the alleged Trump’s obstruction of justice aspect. Based on an article in Reuters, Democrats want the complete Mueller report to be released to Congress by 2 Apr 2019;
g) Markets may get more jittery if more parts of the U.S. yield curve invert. For example, the yield spread between 2Y and 10Y Treasury is around 16bps (The spread was narrower on Mon). There may be some adverse market reactions should this part of the yield curve invert too;
h) U.S. reached its debt ceiling on 2 Mar 2019. Through extraordinary measures by the Treasury Department, U.S. is prevented from breaching its debt ceiling until late Sep or early Oct. This issue will likely rear its ugly head in the next few months as we head towards Sep / Oct.
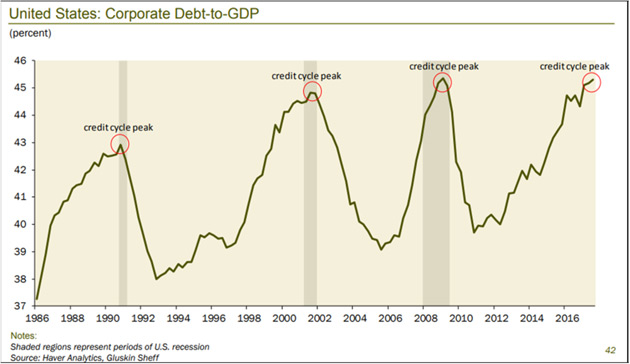
i) Corporate debt –> Much has been written on U.S. corporate debt especially when U.S. economy is slowing down amid the global economic slowdown. A most telling chart can be seen in Chart 1 below. U.S. corporate debt has reached levels near prior peaks which preceded market falls. This phenomenon is not only seen in the U.S. Based on a Bloomberg article dated 26 Mar 2019, Singapore’s top law firm Rajah & Tann Singapore LLP mentioned that weaker companies may find it challenging to refinance their debt amid a slowing Chinese economy and heightened risk aversion among alternative capital providers. Based on Bloomberg compiled data, Southeast Asian companies have maturing debt obligations amounting to US$17.9b in 2019 and this will swell to US$23.2b in 2023.
Chart 1: U.S: Corporate Debt to GDP reaches levels near prior peaks
j) Developments over Brexit –> This remains a wild card but suffice to say that we should have some understanding of which scenario shall happen in the next few months;
k) “Speculative frenzy” in some parts of the market which may render them highly vulnerable to sudden market falls. For example, China markets have soared almost 22% from 3 Jan 2019 through 26 Mar 2019. Based on a Bloomberg article dated 22 Mar 2019, Shanghai-based Foresight Fund, managed by Chen Guangming secures US$10b in funding in 10 hours for his fund (This seems to be a case in point for speculative frenzy). Closer to home, some Singapore small mid cap stocks have rallied in the region of 30-60% post their results last month far above analysts’ target prices.
What do the charts say?
S&P500 chart
Based on Chart 2 below, S&P500 has broken the the long-term uptrend line established since Feb 2016. However, it has breached the short-term downtrend line established since Oct 2018 on 15 Jan 2019. S&P500 has touched a 5 month high since Oct 2018 on 21 Mar 2019 and closed at 2,818 on 26 Mar 2019, up 20.1% since the low on 26 Dec 2018. ADX closed around 20.1 on 26 Mar 2019 amid positively placed DI. RSI closed at 57.5 on 26 Mar 2019. All indicators especially OBV, MACD and MFI showed clear bearish divergence on 25 Feb 2019 and 21 Mar 2019 (the two recent peaks). [RSI showed mild bearish divergence].
Although the exponential moving averages (“EMAs”) are still rising (i.e. Trend is up), the bearish divergences showed by the multiple indicators may indicate that the recent up-move is not sustainable.
Near term supports: 2,799 / 2,786 / 2,749 – 2,756 / 2,743 / 2,722
Near term resistances: 2,860 – 2,862 / 2,883 / 2,913 / 2,940
Chart 2: S&P500 bearish divergences fuel concerns
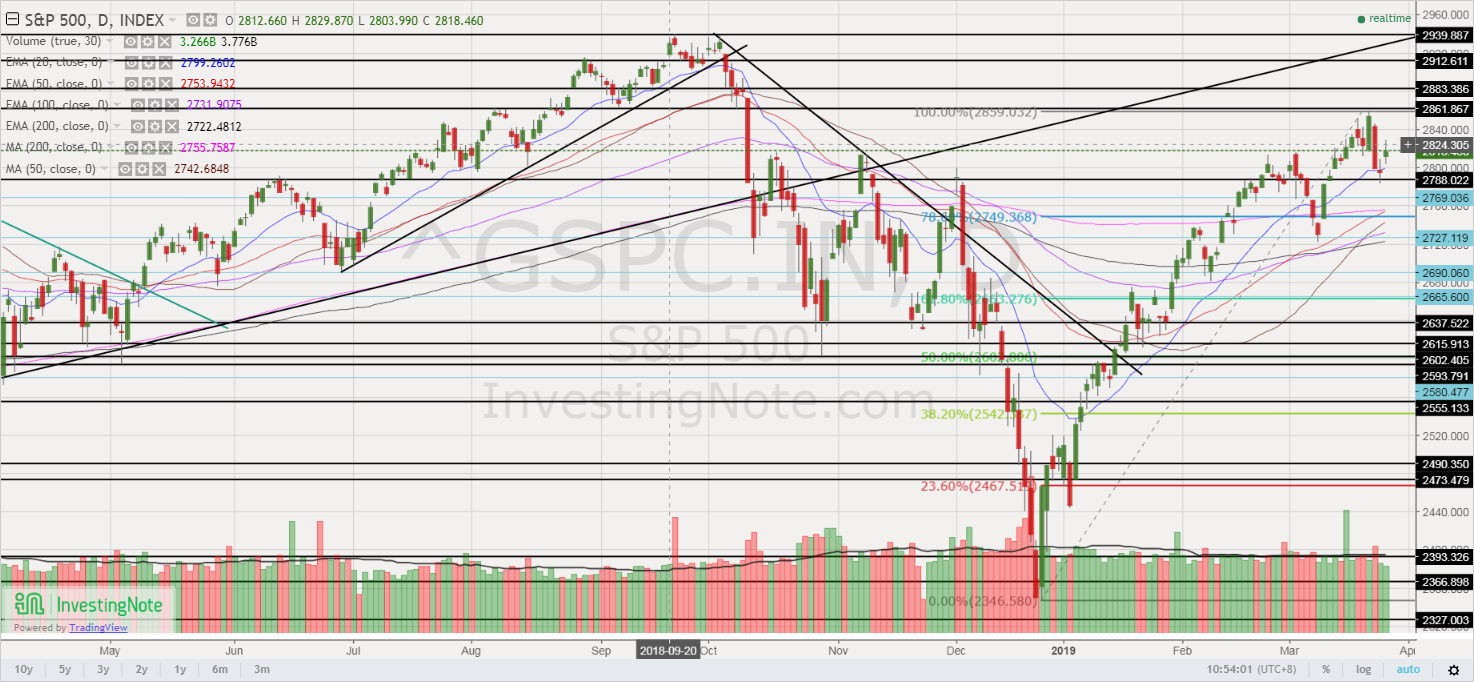
Source: InvestingNote 26 Mar 2019
STI chart
Based on Chart 3 below, STI has jumped 215 points, or 7.2% from the intra-day low of 2,993 on 4 Jan 2019 to trade 3,208 today. In fact, STI has touched an intra-day high 3,286 on 20 Feb 2019 before profit taking set in. ADX last trades 10.5 on 26 Mar 2019 amid negatively placed Dis. Short term EMAs such as 20D and 50D are falling with 200D EMA flat. RSI last trades 48.7 on 27 Mar 2019 after touching a recent high of 68.1 on 20 Feb 2019.
It is noteworthy that unlike Hang Seng and S&P500, STI did not touch a multi-month high this month. This may be because STI may have peaked earlier last month. There is a confluence of support 3,183 – 3,188, followed by a more critical support region 3,150 – 3,158. We will only know whether STI may have peaked in Feb if it stages a sustained break below 3,150 – 3,158 with volume expansion. A sustained break below 3,150 may open STI to more downside.
Near term supports: 3,183 – 3,188 / 3,150 -3,158 / 3,133 – 3,136
Near term resistances: 3,216 – 3,219 / 3,232 / 3,250 / 3,285 / 3,295
Chart 3: STI may have peaked last month
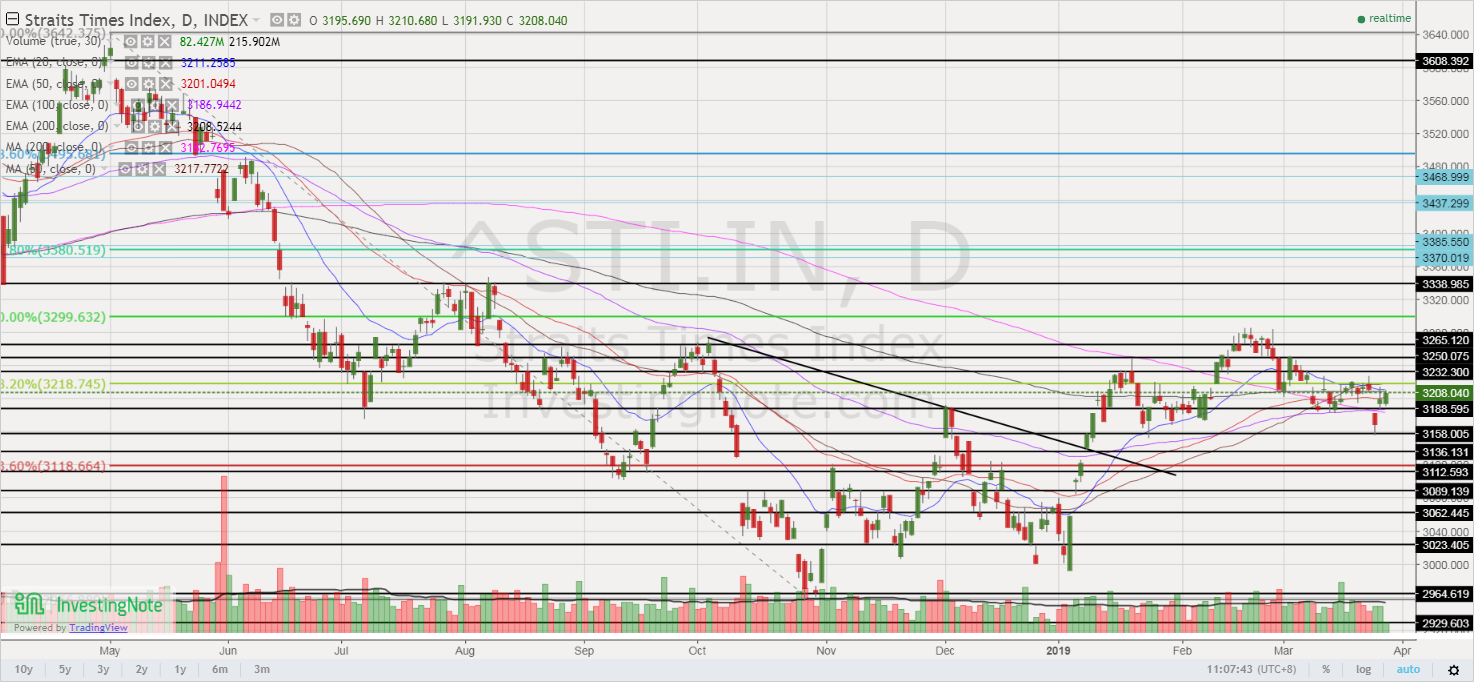
Source: InvestingNote 27 Mar 2019
As usual, there are other positive points to consider…
Notwithstanding the aforementioned points, readers should note that there are definitely other positive points to consider so as to have a balanced and informed perspective. Some of the positive points include:
a) Most investment banks, or / and strategists are saying that an inverted yield curve may not mean a recession is definitely on the horizon as the yield curve is skewed with central banks’ actions all these years;
b) Some strategists and analysts are pointing out that even if the inverted yield curve is a good recession indicator, it is not an immediate indicator to sell all stocks. In fact, based on their analysis, stocks deliver strong returns immediately after the yield curve inverted (see article HERE);
c) There are some market watchers who point out that although the economy is experiencing a slowdown, the economy is not that weak. In fact, some say that the economy may have already bottomed etc etc.
Important drivers which we should take note in the next couple of months
Notwithstanding the plethora of information and data points which we need to take note, in my opinion, I am paying special attention to the following two drivers, namely 1QFY19 corporate results & their upcoming guidance and price action on the indices.
Firstly, we should start to have a sense of U.S. 1QFY19 corporate results in the next few weeks. Furthermore, it is imperative to see how the U.S. corporates guide for their 2Q results so as to gauge the probability of an earnings recession. Recall in my 23 Dec 2018 write-up (click HERE), I mentioned most strategists believe that the bull market is likely to end when three conditions occur, namely inverted yield curve, earnings recession and economic recession.
Secondly, I will see how the indices’ chart pan out in the next few weeks. i.e. Whether they breach recent highs, or they break important supports may provide important clues to formulate future action plans.
My personal strategy – 5% invested for now, awaits trading opportunities
In view of the above, I am generally cautious on the equity market with a view that volatility may return in the next couple of months. I am only 5% invested but remain ready for trading opportunities, especially if markets overshoot either on the upside or downside.
I have generated a list of stocks sorted by total potential return using Bloomberg data as of 25 Mar 2019 for my clients and have sent the full compilation to them two days ago. For the benefit of my readers, I have summarised the Top 10 stocks by total potential return in Table 1 and the last 10 stocks by total potential return in Table 2. Amara, Yoma and OUE rank as top 3 stocks sorted by total potential return. UMS, Cosco and Hi-P rank the lowest in terms of total potential return. Please refer to the tables and the important notes below.
Table 1: Top 10 stocks by total potential return
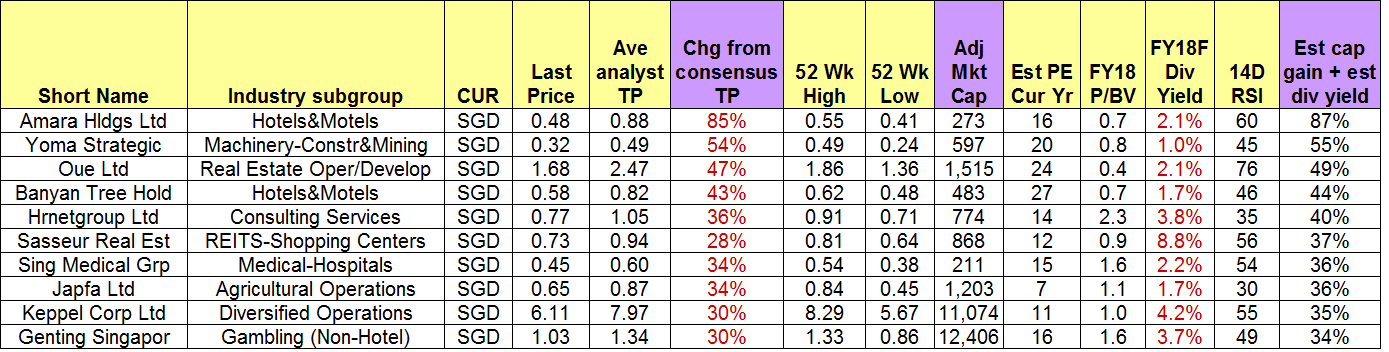
Source: Bloomberg 25 Mar 2019
Table 2: Last 10 stocks by total potential return
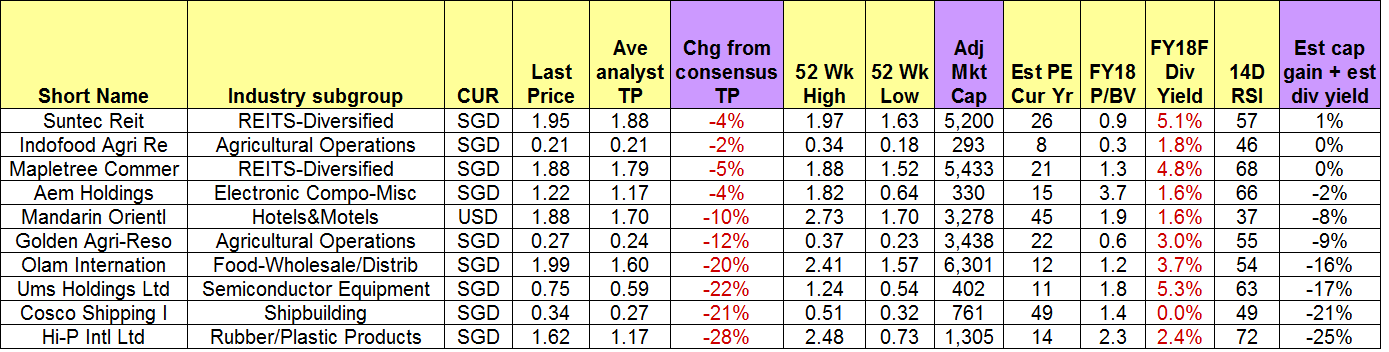
Source: Bloomberg 25 Mar 2019
Criteria
1. Presence of analyst target price and estimated dividend yield;
2. Market cap >=S$200m
Caveats
1. This compilation is just a first level stock screening, sorted purely by my simple criteria above. It does not necessary mean that Amara is definitely better than Genting Singapore or UOB bank in terms of stock selection.
2. Even though I put “ave analyst target price”, some stocks may only be covered by one analyst hence may be subject to sharp changes. Also, analysts may suddenly drop coverage;
3. Analyst target prices and estimated dividend yield may be subject to change anytime, especially after results announcement or after significant news announcements;
Important caveat
Naturally, my market outlook and trading plan are subject to change as charts develop. My plan will likely not be suitable to most people as everybody is different. Do note that as I am a full time remisier, I can change my trading plan fast to capitalize on the markets’ movements (I am not the buy and hold kind). Furthermore, I wish to emphasise that I do not know whether markets will definitely rebound or continue to drop. However, I am acting according to my plans. In other words, my market outlook; portfolio management; actual actions are in-line with one other. Notwithstanding this, everybody is different hence readers / clients should exercise their independent judgement and carefully consider their percentage invested, returns expectation, risk profile, current market developments, personal market outlook etc. and make their own independent decisions.
Readers who wish to be notified of my write-ups and / or informative emails, can consider signing up at http://ernest15percent.com. However, this reader’s mailing list has a one or two-day lag time as I will (naturally) send information (more information, more emails with more details) to my clients first. For readers who wish to enquire on being my client, they can consider leaving their contacts here http://ernest15percent.com/index.php/about-me/
Disclaimer
Please refer to the disclaimer HERE
Hi there, You’ve done a great job. I will definitely digg it and personally suggest to my friends.
I am confident they will be benefited from this website.