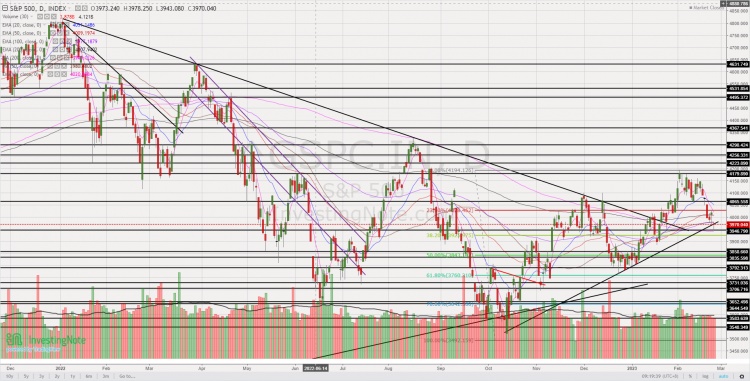
U.S & European stocks logged their largest weekly falls for 2023. What’s next for the equity markets? (26 Feb 23)

Dear all With reference to my writeup published on 30 Jan 2023 (click HERE), where I mentioned I would be cautious in the overall markets, especially after a sharp run up, US stocks have dropped consecutively for the in the past three weeks. Dow has fallen consecutively for the past three weeks and logged its sharpest 1,010 points or 3.0% last week.   So, what is next for our markets? Do we buy, hold or sell? Just to highlight, the below is a sample of a brief stock alert or / and observation which I typically send to my clients […]

3 stocks, Comfort Delgro, Thai Bev and Wilmar trade at attractive valuations (11 Oct 22)

Dear all Yesterday, Comfort Delgro, Thai Bev and Wilmar closed at $1.25; $0.565 and $3.64 respectively. Personally, they look interesting on several aspects. At $1.25, Comfort Delgro trades at levels last seen in 2011 and 2009! At $0.565, Thai Bev sits on a long term uptrend line established since 2009! At $3.64, Wilmar trades at approximately 2.2x and 3.0x standard deviations below its 10Y average PE and P/BV of around 13.8x and 1.1x respectively! Read on for more.   *Comfort Delgro* I have previously published a write-up on Comfort Delgro. Readers can refer to my write-up HERE for more information […]

Markets may continue to be volatile but also present valuable opportunities ahead (6 Mar 2022)

Dear all We are two months into 2022. How is your portfolio doing? With reference to my writeup (click HERE) published on 17 Feb 2022, I mentioned that STI is likely to face headwinds in the near-term and SG banks’ share prices are likely to peak around 7-18 Feb based on past observations.   Coincidentally a) STI peaked on 17 Feb. In fact, STI has tumbled 6.9%, or 239 pts from its intraday high 3,466 on 17 Feb to close 3,227on 4 Mar. Last Friday’s intraday low was 3,208. More about its chart below. b) Banks – DBS peaked on […]

Chart alert! Yoma may breach $0.280 in the near term (23 Jun 2020)

This week, Yoma catches my attention on a spike in share price, accompanied with an expansion in volume. Let’s take a look.   Chart analysis Yoma’s chart has been on a short-term uptrend since 24 Mar. ADX last trades 22.2, amid positively placed Dis, indicative of a trend. Its short term exponential moving averages (“EMA”) are rising steadily and its long term moving averages (namely 200D EMA and 200D SMA) are plateauing. Indicators such as OBV and RSI are strengthening. Volume has picked up significantly today and yesterday which may signify good odds of breaching its key resistance $0.275 – […]