Dear all
Markets have been on a tear for the past five months. Since my write-up published on 1 Nov 2020, citing opportunities in our Singapore market (click HERE for the write-up), STI has soared 786 points, or 32.4% from 2,424 on 30 Oct 2020 to close 3,210 on 5 Apr 2021 (intra-day high today was 3,212). At the time of writing this, S&P500 futures are trading at 4,040, translating to around 24% gain over the same period. In fact, STI is the 2nd best performing market for 1Q2021 amongst 18 global benchmarks.
Are markets in the midst of a bubble? Or aren’t they? Let’s take a look at the factors for and against this argument.
Factors against a bubble
It is common knowledge that a flood of money supply, ultra-low or zero interest rates, COVID-19 vaccine rollouts, US$1.9t stimulus spending and US$2 trillion infrastructure bill have sparked a ‘buy everything’ rally. Corporate results have generally surprised on the upside. Much has been discussed on the above factors and I will not go into details due to time constraints.
Factors pointing to a potential bubble
A) Stratospheric stock valuations by some measures
Based on Bloomberg as of 1 Apr 2021, S&P500 is trading at 4.4x P/BV and 3.0x P/S, approximately three standard deviations away from its 10-year average. For P/E, S&P500 trades at 32.8x current PE which is more than three standard deviations away from its 10-year average of 18.9x.
Chart 1: Valuations >=3 standard deviations away from 10Y average

Source: Bloomberg 1 Apr 2021
B) Sentiment data showing exuberance
Based on the panic / euphoria index compiled by Citi Research (see Chart 2 below), it is apparent that euphoria is at the highest since 1987. To put it from another perspective, the reading is higher than during the dot.com period. According to Citi, based on historical trend, this indicator “statistically argues for a 100% chance of losing money”.
Chart 2: Euphoria at the highest since 1987!

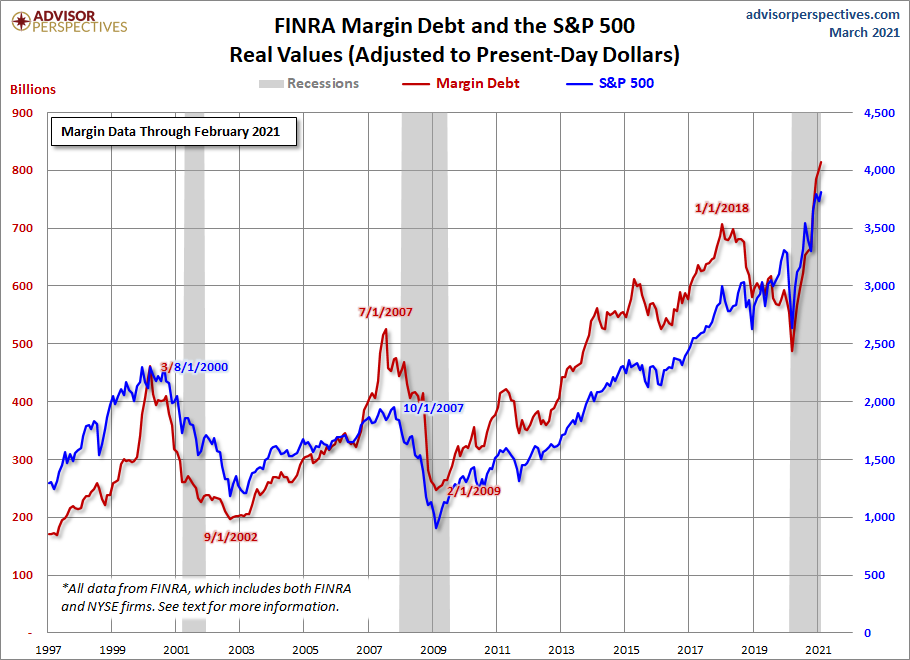
Another indicator that investors can draw some reference to is margin debt. This is the amount of loans which individuals and institutions borrow funds using their securities as collateral. According to FINRA, margin debt has to the highest since 1997 and this typically presage stock market weakness. Leverage is a double-edged sword. The latest to succumb is Archegos Capital which has collapsed due to margin calls resulting from excessive leverage.
Chart 3: Spikes in margin debt typically presage market weakness
C) Elevated retail participation
According to Retail broker eToro, it cited an additional 380,000 new users in the first 11 days of 2021. Closer to home, based on my own observation, there seems to be an increase in risk taking by clients, even for those who are more risk adverse. They are willing to put in larger than their usual investment amounts into stocks which they are not familiar, based usually on some advices from their friends etc. In addition, even less active clients are coming back into the market and asking for higher trading limits.
D) Rising bond yields
10Y bond yields have surged more than 80% in three months from 0.92% on 31 Dec 2020 to around 1.71% on 1 Apr 2021. Against the backdrop of the various stimulus packages being negotiated, coupled with consensus view that economic growth should pick up (at least) in the near term, and with the view that more economies are likely to re-open in 2H2021, bond yields may rise more. If there is a sharp rise in bond yields in a short span of time, it may have an adverse impact to the stock market.
E) Divergence in technical chart
Based on Chart 4, S&P500 closed at a record 4,020 on 1 Apr 2021. Notwithstanding the rise in S&P500 since 4 Mar 2021, it is accompanied with lower-than-average volume. ADX has started to slide to close 11.3 amid positively placed Dis, indicative of a lack of trend. Furthermore, there are obvious signs of bearish divergence of indicators vs price since the recent high on the indicators on 12 – 17 Feb.
Near term supports: 3,973 / 3,935 / 3,911 / 3,879 – 3,888
Near term resistances: 4,025 / 4,044 – 4,050 / 4,075
Although bearish divergences in the indicators do not necessarily indicate an immediate sell signal, they are considered as yellow flags which we need to be careful.
Chart 4: S&P500 closed at a record high on 1 Apr 2021
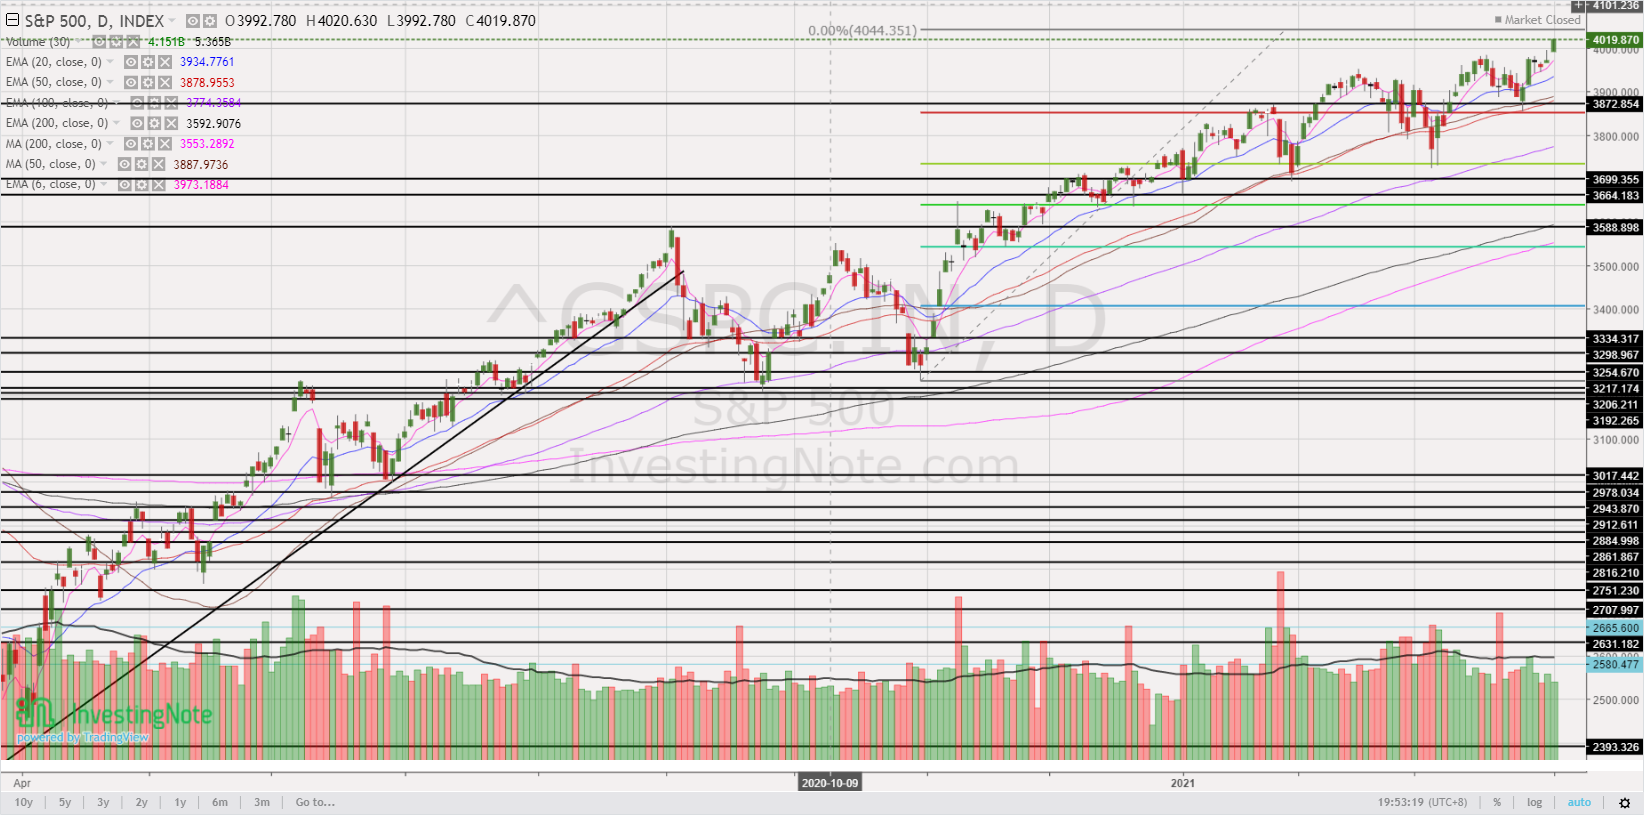
Source: InvestingNote 1 Apr 2021
F) Corporate tax
According to Citi, S&P500 earnings may drop 4-5% if the corporate tax rates were to increase from 21% to 25%. S&P500 earnings may drop approximately 6-7%, should the corporate tax rate be raised to 28%. Against the backdrop of exceedingly high valuations, a drop in earnings is likely to exacerbate the pricey valuations.
Conclusion
To sum up, S&P500’s high valuations may indicate (to some extent) some potential positive news has been priced in and market may be susceptible to sell off if there are disappointments. Disappointments can come in various forms such as a resurgence in Covid 19 cases (or vaccines prove less effective than expected); lower than expected corporate results or / and guidance in 2021 etc,
Similar to other investors. I do not have any crystal ball to foretell the future. However, given the above factors, I am cautious and have sold into strength. I have reduced my percentage invested to around 50-60% invested so that I can be ready to accumulate on weakness. (I can raise my percentage invested to more than 200% if necessary, with leverage, hence 50-60% invested is rather little to me and pretty comfortable even if there is some pull back in the market)
Nevertheless, I hasten to add that the answer on whether this is a good time to buy, or sell depends on your percentage invested; market outlook; portfolio constraints; opportunity costs; risk profile etc. Thus, for those who are unsure, it is better to seek a professional financial adviser for advice.
Readers who wish to be notified of my write-ups and / or informative emails, can consider signing up at http://ernest15percent.com. However, this reader’s mailing list has a one or two-day lag time as I will (naturally) send information (more information, more emails with more details) to my clients first. For readers who wish to enquire on being my client, they can consider leaving their contacts here http://ernest15percent.com/index.php/about-me/
Disclaimer
Please refer to the disclaimer HERE
This is one awesome blog post.Really thank you! Want more.
Fantastic blog article.Really looking forward to read more. Cool.
I loved your blog post.Much thanks again. Great.
Wow, great article post.Really looking forward to read more. Much obliged.
Im thankful for the post.Really thank you! Will read on…
Im thankful for the article post.Much thanks again. Awesome.
Very informative article. Really Cool.
This is one awesome post.Much thanks again. Great.
I value the blog article.Really thank you! Really Great.
Enjoyed every bit of your article post.Really thank you! Keep writing.
wow, awesome article.Really looking forward to read more. Really Great.
I really enjoy the blog article.Much thanks again. Want more.
A big thank you for your article.Much thanks again.
I really like and appreciate your blog article.Thanks Again. Great.
Really informative article.Really looking forward to read more. Really Cool.
I appreciate you sharing this post.Really looking forward to read more. Really Great.
Thanks for the post.Thanks Again. Cool.
Thanks again for the article post.Really looking forward to read more. Much obliged.
Really enjoyed this post.Thanks Again. Keep writing.
Enjoyed every bit of your blog post.Much thanks again. Great.
I appreciate you sharing this post. Really Cool.
Great, thanks for sharing this article.Thanks Again. Cool.
I really enjoy the blog.Really thank you! Will read on…
Very neat blog article.Much thanks again. Want more.
Thanks for the blog post.Thanks Again. Keep writing.
A round of applause for your article.Really looking forward to read more. Really Cool.
I appreciate you sharing this blog article.Really thank you! Much obliged.
Wow, great blog article.Much thanks again. Want more.
Hey, thanks for the post.Thanks Again. Really Cool.
Very neat article post.Really looking forward to read more. Fantastic.
Very neat blog.Really thank you! Really Cool.
I am so grateful for your blog. Fantastic.
Really appreciate you sharing this blog post.Really looking forward to read more. Cool.
Very good blog.Really looking forward to read more. Great.
A big thank you for your post.Really thank you! Awesome.
wow, awesome blog article.Thanks Again. Really Cool.
I really enjoy the article post.Really looking forward to read more.
I think this is a real great article.Really looking forward to read more. Keep writing.
Looking forward to reading more. Great article post.Much thanks again. Really Great.
Awesome post.Really thank you! Will read on…
Very good blog post.Really looking forward to read more. Fantastic.
Thanks a lot for the blog post.Thanks Again. Awesome.
I truly appreciate this blog post. Much obliged.
Thanks so much for the blog article.Really looking forward to read more. Much obliged.
This is one awesome blog.Much thanks again. Awesome.
Great article post. Awesome.
A round of applause for your blog.Thanks Again. Want more.
Hey, thanks for the post.Really looking forward to read more. Awesome.
pFjtZMHOz
I think this is a real great post.Much thanks again. Keep writing.
A big thank you for your blog post. Fantastic.
I value the article post. Fantastic.
Im grateful for the article. Great.
Fantastic article post. Cool.
Im obliged for the blog article.Really looking forward to read more. Awesome.
Great, thanks for sharing this blog. Will read on…
Wow, great article.Thanks Again. Fantastic.
Looking forward to reading more. Great blog article.Thanks Again. Want more.
I appreciate you sharing this blog article.Thanks Again. Awesome.
A big thank you for your blog.Really looking forward to read more. Want more.
Major thankies for the blog.Much thanks again. Really Great.
Fantastic blog article.Thanks Again. Cool.
Very neat post.Thanks Again. Keep writing.
A big thank you for your article.Really thank you! Much obliged.
wow, awesome blog.Much thanks again. Really Cool.
Very neat article post.Much thanks again.
Hey, thanks for the article post.Really looking forward to read more. Cool.
Thanks so much for the blog. Cool.
Thank you for your article post.Thanks Again. Awesome.
Thanks a lot for the blog article. Keep writing.
Very neat blog article.Really looking forward to read more. Really Cool.
I value the article.Much thanks again. Fantastic.
Say, you got a nice blog post.Much thanks again. Really Cool.
Thanks so much for the blog article.Really looking forward to read more. Much obliged.
Thank you ever so for you blog post.Thanks Again. Really Great.
Really appreciate you sharing this blog post.Really thank you! Great.
I cannot thank you enough for the article.Much thanks again. Keep writing.
Wow, great article. Will read on…
Awesome blog.Thanks Again. Really Great.
Thank you ever so for you post.Really looking forward to read more.
Enjoyed every bit of your blog article.Much thanks again. Cool.
Wow, great article post.Really thank you! Cool.
Very good article.
A big thank you for your article post.Thanks Again. Cool.
Im thankful for the blog post.Really thank you! Cool.
I cannot thank you enough for the article post. Awesome.
Thanks for sharing, this is a fantastic blog article.Really looking forward to read more. Fantastic.
I think this is a real great blog.Really looking forward to read more. Keep writing.
I value the article.
Thank you ever so for you blog post.Really thank you! Much obliged.
Really appreciate you sharing this article post.Really thank you! Really Cool.
A big thank you for your article post.Really looking forward to read more. Want more.
I truly appreciate this article.Much thanks again.
Enjoyed every bit of your blog post.Really thank you! Keep writing.
Thanks again for the article post.Thanks Again. Keep writing.
Thank you ever so for you blog article.Much thanks again. Really Cool.
A round of applause for your blog article. Really Great.
A round of applause for your post.Really thank you! Much obliged.
A round of applause for your article post.Really thank you! Awesome.
Thanks for the blog post. Really Cool.
Thanks-a-mundo for the post.Thanks Again. Want more.
Really informative blog post.Really looking forward to read more. Will read on…
Thanks again for the blog post.Thanks Again. Will read on…