Swiber has dropped 8% in seven trading days, from an intraday high of $0.685 on 3 Apr to $0.630 on 12 Apr. Contrast this with its 57.5% owned subsidiary Kreuz which closed at $0.530, near its all time closing high of $0.535. (Based on Chart 1 below, Swiber was nowhere near the recent high of around $0.720 on 27 Feb which was briefly touched upon after its release of 4QFY12 results.)
Chart 1: Swiber dropped five consecutive days. Supports 0.620 -0.630 / 0.610
Source: CIMB itrade complimentary chart (12 Apr 13)
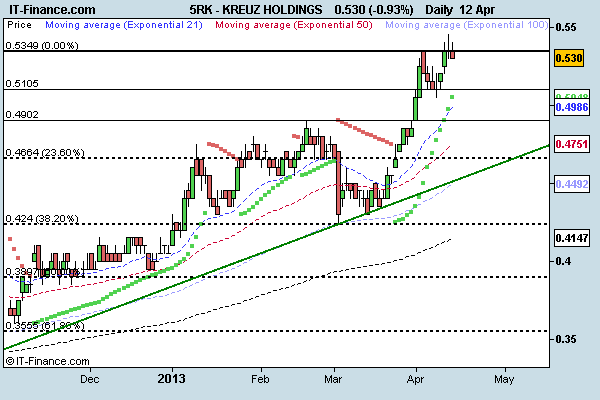
Chart 2: Kreuz closed near record closing high of $0.535
Source: CIMB itrade complimentary chart (12 Apr 13)
Swiber’s 4QFY12 results update
Swiber reported a good set of results on 27 Feb 2013 where it achieved record earnings and revenue since listing. On the whole, FY12 revenue jumped 46% and 48% on a year on year basis to US$952m and US$63m respectively. Gross profit margins were in line with management guidance of 15-20%. Swiber’s share price momentarily gapped up after the results and traded to an intraday high of $0.720. However, it subsequently drifted lower.
Table 1: Swiber’s FY12 results snapshot
Source: Company
Achieved a milestone in project execution
Swiber announced on 20 Feb 2013 that it had successfully executed floatover operation with the B-193 Field Development project in India for the country’s national oil company, Oil and Natural Gas Corporation Ltd. (“ONGC”), Swiber’s long standing customer in India. This was noteworthy on three points. Firstly, this floatover method involved extensive engineering capabilities. Secondly, Swiber managed to use most of their in house assets in the project execution. Thirdly, this method resulted in significant cost savings for ONGC which strengthened their relationship and might lead to more collaborations and contract awards in the future.
Order & tender books
As of end Feb 2013, Swiber’s order book stood at around US$1.35b. Swiber’s tender book was around US$2.4b and might reach US$3b by end 2013. According to OCBC Research, they estimated that about 50% of the order book would be recognised in 2013 and 20-25% of the tender books are for commencement in 2013.
Figure 1: Swiber’s order book trend
Source: Bloomberg, Maybank – KE
Swiber’s business ex Kreuz worth only approx S$213m
Swiber has about 57.5% in Kreuz. With reference to my previous writeup on Kreuz (see
http://www.sharesinv.com/articles/2013/04/02/kreuz-holdings-good-results-strong-chart-low valuations/), Kreuz’s business seems to be on an uptrend. On the back of its order book and potential variation orders, Kreuz is likely to turn in a better FY13F than FY12, notwithstanding that FY12 was already a record year in terms of revenue and net profit since listing. The industry dynamics for subsea business remains sanguine. As a result, the investment community may be starting to warm up to Kreuz. Kreuz closed at $0.530, near its all time closing high of $0.535.
Kreuz’s market capitalization is around $295m. Swiber’s market capitalization is around $383m, of which 44% can be attributable to Kreuz. In other words, Swiber’s business (ex Kreuz) is only worth approximately S$213m.
Some noteworthy points though…
Some noteworthy points that the investment community are concerned about are firstly, Swiber’s leverage and negative operating cash flow. With the exception of 4QFY12, Swiber recorded five quarters of negative operating cashflows. In addition, based on Swiber’s 4QFY12, they have about US$207m of loans repayable in one year or less. To this, Swiber has been active in tapping the debt markets, albeit (typically) at a higher cost than their existing loans.
Secondly, some investors pointed to Swiber’s lumpy results and management’s guidance of gross margin of 15-20% which is rather broad and makes forecasting difficult. To be fair, companies in this sector typically have lumpy results. The wide gross margin guidance can be due in part to the contract type. For Engineering, Procurement & Construction contracts, this has a higher material procurement portion which typically pushes gross margins lower than the pure execution of transportation and installation projects.
Valuations
With reference to Table 2, Swiber’s valuations are one of the lowest among its peers. Its FY13F PE and FY13F P/BV are the 2nd lowest relative to its peers. If we compare Swiber’s estimated PE valuation from 2008 to 2012 (See Figure 2), it is trading more than one standard deviation below the 5 year average estimated PE from 2008 – 2012.
Table 2: Swiber’s valuations vis-à-vis its peers
|
Short Name
|
Cur
|
Last Px
|
Analyst TP
|
Change in TP
|
1 Yr high
|
1 Yr low
|
Adj Mkt Cap (S$m)
|
FY13F PE
|
ROE (%)
|
FY13F P/Bv
|
Est Div Yield
|
|
Swiber Holdings
|
SGD
|
0.640
|
0.816
|
27.5
|
0.725
|
0.510
|
390.7
|
5.4
|
11.2
|
0.6
|
1.7
|
|
Kreuz Holdings
|
SGD
|
0.535
|
0.630
|
17.8
|
0.545
|
0.245
|
298.0
|
5.3
|
29.4
|
1.2
|
NA
|
|
Ezion Holdings L
|
SGD
|
2.11
|
2.417
|
14.6
|
2.230
|
0.710
|
2,027.9
|
12.7
|
19.5
|
2.4
|
0.1
|
|
Ezra Holdings Lt
|
SGD
|
1.080
|
1.310
|
21.3
|
1.360
|
0.821
|
1,057.1
|
16.2
|
6.3
|
0.8
|
0.8
|
|
ASL Marine Hldgs
|
SGD
|
0.700
|
0.873
|
24.8
|
0.750
|
0.550
|
295.4
|
6.8
|
10.3
|
0.8
|
3.1
|
|
Ch Offshore Ltd
|
SGD
|
0.480
|
NA
|
NA
|
0.530
|
0.369
|
338.4
|
7.6
|
15.7
|
0.9
|
7.0
|
|
Mermaid Maritime
|
SGD
|
0.370
|
0.445
|
20.3
|
0.430
|
0.235
|
290.4
|
25.2
|
1.4
|
0.5
|
NA
|
|
|
|
|
|
|
|
|
|
|
|
|
|
|
|
|
|
|
|
|
|
|
|
|
|
Average ex Swiber
|
|
|
|
|
12.3
|
13.8
|
1.1
|
2.7
|
Source: Bloomberg as of 12 Apr 13
Figure 2: Swiber’s forward PE valuation (2008 – 2012)
Source: CIMB Research
Conclusion – May rerate on good project execution & contract wins etc
On the back of their strong order and tender books and given the buoyant industry outlook, it is likely that Swiber’s future years may beat the record revenue and net profit set in 2012. Besides its results, investors may warm up to the stock if Swiber can continue to execute its projects well, improves its cash flow and win more contracts.
Readers who are interested in Swiber can email me at crclk@yahoo.com.sg for the analyst reports and my writeup in pdf complete with figures and tables (as I am not able to attach them here).
Disclaimer
The information contained herein is the writer’s personal opinion and is provided to you for information only and is not intended to or nor will it create/induce the creation of any binding legal relations. The information or opinions provided herein do not constitute an investment advice, an offer or solicitation to subscribe for, purchase or sell the investment product(s) mentioned herein. It does not have any regard to your specific investment objectives, financial situation and any of your particular needs. Accordingly, no warranty whatsoever is given and no liability whatsoever is accepted for any loss arising whether directly or indirectly as a result of this information. Investments are subject to investment risks including possible loss of the principal amount invested. The value of the product and the income from them may fall as well as rise. You may wish to seek advice from an independent financial adviser before making a commitment to purchase or invest in the investment product(s) mentioned herein. In the event that you choose not to do so, you should consider whether the investment product(s) mentioned herein are suitable for you. The writer will not, in any event, be liable to you for any direct/indirect or any other damages of any kind arising from or in connection with your reliance on any information in and/or materials appended herein. The information and/or materials are provided “as is” without warranty of any kind, either express or implied. In particular, no warranty regarding accuracy or fitness for a purpose is given in connection with such information and materials.