Dear all,
I am not able to do the biweekly “Ernest’s market outlook” as I am in the midst of transiting to another chart platform.
While I am still exploring Chartnexus, here is my interpretation of our STI chart.
STI
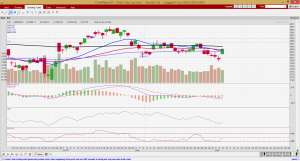
Based on Chart 1 below, STI faces a cluster of resistances at 2,865 – 2,870, followed by 2,882. ADX remains weak at 17 on 5 Sep 2016, indicative of a lack of trend. Indicators such as OBV, MFI continue to slide with price. RSI closed at 50.5 today. A sustained break below 2,800 is bearish for the chart.
Near term supports: 2,840 / 2,820 / 2,800 – 2,810
Near term resistances: 2,865 – 2870 / 2,882 / 2,902
Chart 1: STI is not out of the woods despite Mon’s 1.7% surge
Source: Chartnexus as of 5 Sep 16
Conclusion
My personal view is that we have to be generally cautious in Sep. Nevertheless, I may do some opportunistic trades in some stocks with potential near term catalysts on weakness. (My clients have, will & are informed on new stocks which I have entered and any significant portfolio change.) Please refer to the following articles for more information on my market outlook:
1. Caution ahead? Most market strategists think so… (26 Aug 2016) (Click HERE)
2. Ernest’s market outlook (19 Aug 16) (Click HERE)
Readers who wish to be notified of my write-ups and / or informative emails, can consider signing up at http://ernest15percent.com. However, this reader’s mailing list has a one or two-day lag time as I will (naturally) send information (more information, more emails with more details) to my clients first. For readers who wish to enquire on being my client, they can consider to leave their contacts here http://ernest15percent.com/index.php/about-me/
Disclaimer
Please refer to the disclaimer HERE

Say, you got a nice blog post.Much thanks again. Will read on…