Dear readers,
S&P500 has jumped 5.2%, or 95 points from the intraday low of 1,812 on 20 Jan 2016 to close at 1,907 yesterday. Has market reached the bottom and is due for a V shape reversal, similar to Sep 2015?
Read on to find out more…
S&P500 Index
Just to recap what I have mentioned on 9 Jan 2016 (read here), I wrote “the chart has turned bearish due to the formation of death crosses with rising ADX. In addition, S&P500 has broken a long term uptrend established since Nov 2011”
–> S&P500 continued to display its bearish price performance by falling 110 points, or 5.7% from 1,922 on 8 Jan 2016 to an intraday low of 1,812 on 20 Jan 2016, before rebounding 5.2%, or 95 points to close at 1,907 on last Fri.
I also mentioned “RSI has dipped to 29.7, the lowest since 26 Aug 2015 which may trigger a mild rebound as oversold pressures mount.”
–> S&P500 only managed to rebound from 1,922 on 8 Jan to an intraday high of 1,950 on 13 Jan 2016 before slumping to close at 1,907 on last Fri.
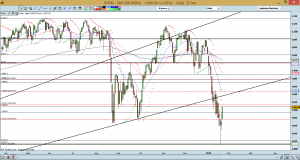
Looking ahead, S&P500 has become very volatile with large intraday swings. As mentioned two weeks ago, the overall chart has turned bearish due to the formation of death crosses with a rising ADX. ADX continued to rise from 22.2 on 8 Jan 2016 to 38.0 on 22 Jan 2016, indicative of a strong trend. RSI has risen from 29.2 on 20 Jan 2016 to 40.0 on 22 Jan 2016, thus it is no longer oversold. As the overall trend is bearish in the medium term, any rebound is likely to be short lived and arrested around the near term resistance region of around 1,940 – 1,946. Based on the current chart interpretation, the bearish outlook of the chart is negated with a sustained close above 2,040 – 2,050 (See Chart 1 below).
Near term supports: 1,894 / 1,875 / 1,867
Near term resistances are around 1,915 / 1,940 – 1,946 / 1,970
Chart 1: S&P500 rebounds 5.2% from the intraday low of 1,812 on 20 Jan
Source: CIMB chart as of 22 Jan 2016
Hang Seng Index
On 9 Jan 2016, I mentioned that “Hang Seng broke the lower line of the downward channel and has a bearish tinge to its chart. A bearish outlook is confirmed if it breaks 20,300 – 20,368 on a sustained basis.”
–> It was indeed bearish after Hang Seng broke 20,300 – 20,368 on 11 Jan 2016 with a gap down. It continued to slide 1,766 points, or 8.7% to touch an intraday low of 18,534 on 21 Jan 2016, before closing at 19,081 on last Fri.
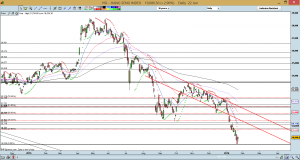
The medium term outlook on Hang Seng’s chart continues to be bearish. All the exponential moving averages (“EMAs”) are sloping downwards with a rising ADX. ADX has risen sharply from 19.4 on 8 Jan 2016 to 39.8 on 22 Jan 2016, indicative of a strong downtrend. RSI closed at 32.7 on last Fri which is not oversold. The break below 20,305 points to a measured eventual technical target of 17,180. This represents potential but does not mean it’s a definite outcome. Meanwhile, the strong bearish chart outlook is alleviated to a certain extent if Hang Seng can close above the strong resistance at 20,305 – 20,408 on a sustained basis. (See Chart 2 below).
Near term supports: 18,534 / 18,304 / 18,054
Near term resistances: 19,660 – 19,693 / 19,787 / 20,116 – 20,170
Chart 2: Hang Seng – strong downtrend
Source: CIMB chart as of 22 Jan 2016
STI Index
I wrote that “STI’s important support is around 2,698 – 2,740. It will be negative if it breaks on a sustained basis.”
–> It was indeed true that once STI broke the important support of 2,698 on 12 Jan 2016 on a sustained basis, the subsequent price performance was bearish. It subsequently fell another 169 points, or 6.3% to touch an intraday low of 2,529 on 21 Jan 2016, before closing at 2,577 on 22 Jan 2016.
I published my market outlook on STI on 17 Jan 2016, last Sun on my blog noting the sharp drop in the STI; STI’s & our three local banks’ valuations and a list of oversold stocks. (Please see here for the write-up.) I mentioned that there may be a technical rebound in the near term as oversold pressures build. Nevertheless, the technical rebound, if any, is unlikely to be a trend reversal.
–> STI seems to be staging a potential near term technical rebound starting from last Fri where it closed 1.8% higher at 2,577.
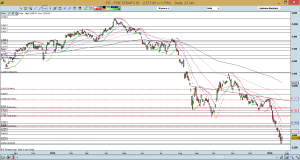
Looking ahead, similar to Hang Seng and S&P500, the overall chart outlook continues to be bearish in the medium term. There may be short term technical rebound but it is likely to meet with considerable resistance at 2,698 – 2,740 (likely 2,698) and is unlikely a trend reversal. The bearish chart can be negated to a certain extent if it can close above 2,698 – 2,740 on a sustained basis. (See Chart 3 below)
Near term supports: 2,529 / 2,498 – 2,500 / 2,488
Near term resistances: 2,630 / 2,664 – 2,670 / 2,698
Chart 3: STI formidable resistance at 2,698 – 2,740
Source: CIMB chart as of 22 Jan 2016
FTSE ST Small Cap Index (“FSTS”)
On 22 Jan 2016, I wrote that “FSTS seems to be stronger on a relative basis. Firstly, FSTS’ did not form a lower low in Sep 2015 (vs Aug 2015) whereas S&P500, Hang Seng and STI did. Secondly, FSTS is still about 7 points away from its intraday low on 15 Dec 2015 low whereas both Hang Seng and STI are re-visiting Sep 2015 lows.
–> FSTS indeed has greater relative strength than STI. Firstly, since the start of 2016, FSTS has dropped about 7.0% vs the 10.6% drop for STI. Secondly, FSTS has not breached the intraday low of 368 on 25 Aug 2015. In fact, FSTS’ intraday low on 21 Jan 2016 was 371. However, STI has touched more than a 4-year low with its intraday low of 2,529 on 21 Jan 2016.
I also wrote that “We have to observe whether FSTS can successfully test the support of 391. A sustained break below 391 is negative.”
–> This is true. FSTS broke below 391 on 14 Jan 2016 and subsequently fell another 20 points, or 5.1% to touch an intraday low of 371 on 21 Jan 2016.
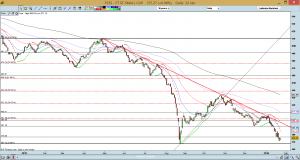
With reference to Chart 4 below, FSTS’ indicators such as RSI and MACD have exhibited bullish divergence. Notwithstanding FSTS’ greater relative strength vs STI, FSTS’ overall chart continues to be on a downtrend as depicted by its EMAs and rising ADX. ADX has risen from 22.1 on 8 Jan 2016 to 38.0 on 22 Jan 2016. A sustained break below 368 is negative whereas a sustained break above 392 should reduce some of the bearishness to a certain extent.
Near term supports are at 371 / 368 / 365.
Near term resistances are at 385 / 389 / 392.
Chart 4: FSTS continues to have greater relative strength vs STI
Source: CIMB chart as of 22 Jan 2016
Conclusion
Over the past two weeks, I have done several trades on a few stocks due to their ultra oversold nature. I have also increased some exposure on my core holdings which raised my current equity allocation from 143% on 8 Jan 2016 to approximately 158%. (My clients have already been notified on 23 Jan via email what I am holding at the current moment. Yep, I have a high risk tolerance to be 158% invested in such volatile times.) Nevertheless, I am likely to pare my holdings in the next two weeks.
For those who are little invested and believe that market may be going higher, and are looking to shortlist some stocks for potential investment / trading, I have sorted the top sixty stocks by total potential return using Bloomberg’s data as of 22 Jan 2016. Table 1 shows the top five companies sorted by total potential return. (See Table 1 below). I will be sending the entire list of sixty stocks to my clients and those readers on my website sign up list. Readers can consider to sign up at http://ernest15percent.com so as to be included in my mailing list.
Table 1: Top 5 companies sorted by total potential return
Source: Bloomberg as of 22 Jan 2016
With reference to Table 1 above, it is noteworthy that the source of my data is from Bloomberg. Personally, I do not know how updated the above consensus target price is. For example, with the sharp drop in oil, I am not sure whether the consensus target for Ramba Energy should still be $0.620. Readers should exercise independent judgement and / or seek to verify the data when they are unsure.
As mentioned previously, readers who wish to be notified of my write-ups and / or informative emails, they can consider to sign up at http://ernest15percent.com so as to be included in my mailing list. However, this reader’s mailing list has a one or two-day lag time as I will (naturally) send information (more information, more emails and more details) to my clients first. For readers who wish to enquire on being my client, they can consider to leave their contacts here http://ernest15percent.com/index.php/about-me/
Lastly, Some of you wonder how I screen and decide which companies to write. To understand more about my basis of deciding which companies to write, you can download a copy of my eBook available on my website here.
Disclaimer
Please refer to the disclaimer here


Aweslme article.
Thank you for your article. Keep writing.
Very neat blog post.Much thanks again. Fantastic.
I am so grateful for your post.Really looking forward to read more. Fantastic.
Fantastic article.Really looking forward to read more. Awesome.
Very neat blog.Really thank you! Really Great.
Im grateful for the post. Want more.
Greetings! Very helpful advice in this particular article!It is the little changes that will make the biggest changes.Thanks a lot for sharing!
You can certainly see your expertise within the work you write. The world hopes for more passionate writers like you who are not afraid to say how they believe. Always follow your heart.
In the event that an operator winds up lopsided on a contest, that is a liability on the operator’s end that opensthe book up to losses.
Thanks for some other fantastic post. Where else could anybody get that kind of information in such an ideal meansof writing? I have a presentation next week,and I am at the look for such information.
whoah this blog is magnificent i love reading your articles. Keep up the great work! You know, a lot of people are searching around for this info, you can aid them greatly.
Major thanks for the post.Really thank you! Great.Loading…
I’d like to thank you for the efforts you have put in penning thisblog. I really hope to see the same high-grade content by youlater on as well. In truth, your creative writing abilities has inspired me to get my own blog now
Hi there! Do you use Twitter? I’d like to follow you if that would be ok. I’m absolutely enjoying your blog and look forward to new updates.
Hi, i feel that i noticed you visited my web site thus i got here to “return the prefer”.I’m attempting to to find things to improve my web site!I guess its ok to make use of a few of your ideas!!
You made various good points there. I did a search on the issue and found most people will consent with your blog.
An fascinating discussion is worth comment. I think that you must write more on this subject, it may not be a taboo topic but generally people are not enough to speak on such topics. To the next. Cheers
Hi there! I just want to give a huge thumbs up for the nice information you may have right here on this post. I shall be coming again to your blog for more soon.
Hi there, i read your blog occasionally and i own a similar one and i was just curious if you get a lot of spam comments? If so how do you stop it, any plugin or anything you can recommend? I get so much lately it’s driving me insane so any assistance is very much appreciated.
Nice weblog here! Also your site rather a lot up very fast! What host are you the use of? Can I am getting your affiliate link in your host? I wish my web site loaded up as quickly as yours lol
Once I originally commented I clicked the -Notify me when new comments are added- checkbox and now every time a remark is added I get four emails with the same comment. Is there any way you can remove me from that service? Thanks!
Hey! This is my first comment here so I just wanted to give a quick shout out and say I genuinely enjoy reading through your blog posts. Can you recommend any other blogs/websites/forums that deal with the same topics? Thanks a lot!
Awesome blog! Do you have any tips and hints for aspiring writers? I’m hoping to start my own website soon but I’m a little lost on everything. Would you advise starting with a free platform like WordPress or go for a paid option? There are so many options out there that I’m totally confused .. Any recommendations? Many thanks!
A fascinating discussion is worth comment. I do believe that youought to write more about this subject matter, it maynot be a taboo subject but typically people don’t talk about suchtopics. To the next! Cheers!!
Wonderful write ups, Many thanks!how to write reflective essay college persuasive essays business letter writing service
Hi my friend! I wish to say that this article is amazing, nice written and include approximately all significant infos. I would like to see more posts like this.
I really liked your article. Fantastic.
wow, awesome blog post.Really looking forward to read more. Fantastic.
Thanks so much for the article post. Cool.
Really enjoyed this article.Thanks Again. Much obliged.
Hey, thanks for the blog post.Really thank you! Great.
Hi there mates, good article and fastidious urging commentedat this place, I am genuinely enjoying by these.
Awesome article post.Really looking forward to read more.
Very good post.Really looking forward to read more. Great.
I think this is a real great blog article.Really looking forward to read more. Really Great.
Excellent way of telling, and nice post to get facts concerningmy presentation focus, which i am going to deliver in school.
The DARKO NBA projection model makes provides picks,odds, win probability, and team rankings through the NBA Playoffs.
I savour, cause I discovered just what I was having a look for. You’ve ended my four day lengthy hunt! God Bless you man. Have a nice day. Bye
That is a good tip especially to those new to the blogosphere.Brief but very accurate information… Appreciate your sharing this one.A must read post!
I blog frequently and I seriously thank you for your information. The article has truly peaked my interest. I’m going to take a note of your blog and keep checking for new information about once a week. I opted in for your RSS feed too.
games using solely our Playstation enough free PSN card to giveaway.
Hi, I do think this is a great blog. I stumbledupon it I am going to return yet again since I book-marked it. Money and freedom is the best way to change, may you be rich and continue to guide others.
Çevrimiçi oyun oynamayı seviyorsanız ve bu çevrimiçi oyunları oynama ve kazanma konusunda deneyiminiz varsa, oynamayı ve yapmaktan hoşlandığınız şeyi yapmak için ödeme almayı düşünmelisiniz.
Ahaa, its good dialogue about this article at this place at this blog, Ihave read all that, so at this time me also commentinghere.
It’s actually a great and helpful piece of info. I’m glad that you just shared this useful info with us. Please keep us up to date like this. Thank you for sharing.
stromectol for sale ivermectin 1 topical cream
Im obliged for the blog article.Much thanks again. Keep writing.
erection pills that work trusted india online pharmacies – best medicine for ed
Hello my friend! I want to say that this post is awesome, great written and include almost all significant infos. I would like to look extra posts like this .
Really appreciate you sharing this blog post.Much thanks again.
I truly appreciate this blog article. Want more.
Thanks a lot for the blog.Really thank you! Keep writing.
Great, thanks for sharing this article post.Much thanks again. Really Cool.
Hey, thanks for the article. Will read on…
Hey! This is my first visit to your blog! We are a team ofvolunteers and starting a new initiative in a community in the same niche.Your blog provided us beneficial information to work on. You havedone a extraordinary job!
Betist, bahisçilerin tüm spor etkinliklerine bahis yapmalarına, favori takımlarını desteklemelerine veya nakit ödüller kazanmalarına olanak tanıyan yeni bir.Loading…
Highly energetic blog, I enjoyed that bit. Will there bea part 2?
Great post. I was checking continuously this blog and I’m impressed!Extremely helpful info specially the last part I care for such information a lot.I was seeking this certain information for a very long time.Thank you and best of luck.
Great blog. Keep writing.
Hello There. I found your blog using msn. This is a really well written article.I will make sure to bookmark it and return to read more ofyour useful information. Thanks for the post. I’ll certainly return.
What a information of un-ambiguity and preserveness of valuable know-how on the topic of unexpected feelings.
I really liked your post.Much thanks again. Much obliged.
Hello.This post was really remarkable, particularly since I was searching for thoughts on this issue lastThursday.
modafinil interactions – provigil a stimulant modafinil and caffeine
I enjoy what you guys are up too. This type of clever work and reporting! Keep up the amazing works guys I’ve incorporated you guys to blogroll.
Im grateful for the post. Keep writing.
Fantastic blog. Much obliged.
Fine way of telling, and pleasant post to get data about my presentation topic, which i am going to convey in academy.
A big thank you for your article post.Thanks Again. Really Great.
Muchos Gracias for your blog. Great.
Heya i am for the first time here. I came across this board and I find It trulyuseful & it helped me out a lot. I hope to give something back and help otherslike you helped me.
Major thanks for the post.Really thank you! Cool.
Hi there friends, nice piece of writing and fastidiousurging commented at this place, I am genuinely enjoying by these.
Woh I love your blog posts, bookmarked!my blog Truvita CBD Reviews
I loved your article post. Really Cool.
Hello my loved one! I wish to say that this article is amazing, great written and include approximately all important infos. I would like to see more posts like this.
I’ll bear in mind of your post and inspect once again here continually.
I love it when people come together and share views.Great blog, keep it up!
It’s serious order avanafil online Stan Gocman and Claudia Ressler considered taking legal action against Mr Aurelius after they paid extra for the unedited version of the video of their wedding day after the first version was poor quality.
azithromycin ophthalmic solution generic – generic zithromax over the counter zpack uti infection
Really informative article post. Awesome.
Really appreciate you sharing this blog post.Thanks Again. Really Great.
I truly appreciate this blog article. Awesome.
Thanks again for the blog article.Thanks Again. Really Great.
I am so grateful for your post.Really thank you! Great.
characteristics of essay writing writing up a qualitative research paper english writing essay
Hey, you used to write excellent, but the last several posts have been kinda boring…I miss your great writings. Past few posts are just a little bit out of track!come on!My blog blakeottinger.com