Dear readers,
What a difference the past two weeks make!
Have you benefited from the sharp rally in the equity markets?
Or did u cut loss on your long positions and initiated shorts after the Brexit and cut loss on your shorts due to the sharp rally?
Two weeks ago, I said that I might raise my percentage invested from 71% to 150 – 200% on sharp market selloffs (see HERE). I also mentioned that I have told my clients who are mostly in cash to accumulate some stocks on dips. Indices such as S&P500 and STI have soared above the pre Brexit level. In fact, S&P500 closed at a record closing high last Fri.
What should we do in the next two weeks? Read on for more.
S&P500 Index
Just to recap what I have mentioned on 24 Jun 2016 (see HERE), I wrote “Given the low ADX, the odds of S&P500 breaking below on 2,034 on a sustained basis may be slightly lesser. However, I prefer to wait on the sideline for the S&P500 and monitor over the next few trading sessions. It is noteworthy that volatility is high, thus time is required to monitor the S&P500 chart over the next few trading sessions.”
–> The above interpretation was accurate on various fronts. A) S&P500 was indeed volatile. It broke 2,034 and touched an intraday low of 1,992 (near the previously mentioned support) but closed at 2,001 on 27 Jun 2016. B) It subsequently rallied 138 points, or 6.9% to close at a record high of 2,130. Thus, it is true that firstly, S&P500 did not break below 2,034 on a sustained basis and secondly, time is required to monitor the S&P500 chart.
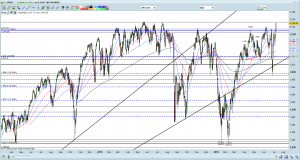
Based on Chart 1 below, with the sharp rally over the past two weeks, S&P500 seems to have broken the trading range 2,034 – 2,111 since 28 Mar 2016 to close at 2,130 on 8 Jul 2016. However, my personal view is that this bullish breakout may not be sustainable. This is because A) ADX has declined from 16.8 on 24 Jun 2016 to 14.3 on 8 Jul 2016, indicative of a lack of trend. B) Indicators such as OBV, MACD and RSI exhibit bearish divergences.
Given the above chart information, it is unlikely that S&P500 may stage a sustainable rally above an intraday all time high of 2,135 on 20 May 2015.
Near term supports: 2,111 / 2,086 / 2,076
Near term resistances: 2,135 / 2,150 / 2,175
Chart 1: S&P500 – unlikely to stage a sustained break above 2,135
Source: CIMB chart as of 8 Jul 2016
Hang Seng Index
On 24 Jun 2016, I mentioned that “ADX has declined from 25.3 on 10 Jun 2016 to 18.6 on 24 Jun 2016, indicative of a lack of trend. As of now, Hang Seng is likely to trade within the range 19,562 – 21,034 in the next two weeks. It is noteworthy that a sustained break below 19,420 – 19,595 is negative for the chart.”
–> Hang Seng traded between 19,899 – 21,166 and closed at 20,564 on last Fri.
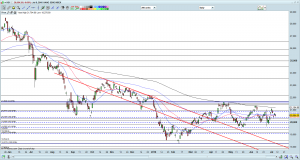
Based on Chart 2 below, ADX has declined from 18.6 on 24 Jun 2016 to 15.3 on 8 Jul 2016, indicative of a lack of trend. As of now, Hang Seng is likely to trade within the range 19,958 – 21,195 in the next two weeks. It is noteworthy that a sustained break below 19,420 – 19,595 is bearish. Conversely, a sustained break above 21,195 is bullish.
Near term supports: 20,355 / 20,120 / 19,958
Near term resistances: 20,845 / 20,955 / 21,195
Chart 2: Hang Seng – likely range trade 19,958 – 21,195 in the next two weeks
Source: CIMB chart as of 8 Jul 2016
STI Index
On 24 Jun 2016, I wrote that “it was comforting to see that STI did not break the recent low of 2,713 on 13 May 2016. ADX has declined from 22.1 on 10 Jun 2016 to close 15.6 on 24 Jun 2016, indicative of a lack of trend. Indicators such as RSI and MACD were mixed with RSI being neutral but MACD in the slightly oversold region. In the next two weeks, STI’s downside should be capped around the support regions of 2,588 – 2,600 / 2,633.
On 28 Jun 2016 morning before market opens, I emailed to all clients to alert them that STI may open weaker at the opening and this opens interesting opportunities. I also reiterated my view that clients who have cash and a long term horizon, they can consider accumulating blue chip stocks.
On 30 Jun 2016, I informed my clients that it may be a good time to take profit on some of their trading positions especially when STI opened 88 points higher at 2,881 on 30 Jun 2016 on possible window dressing.
–> In line with my expectations, STI opened weaker at 2,705 on 28 Jun 2016. However, it rebounded rapidly and closed 142 points, or 5.2% higher to 2,847 on 8 Jul 2016. STI has not traded above 2,881 since it opened at that level on 30 Jun 2016.
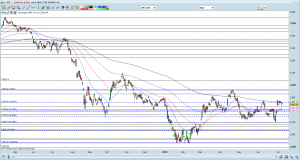
Based on Chart 3 below, it looks a tad positive. ADX has climbed from 15.6 on 24 Jun 2016 to 19.1 on 8 Jul 2016. Although this is still below 20, the increase is noteworthy. 100D, 50D and 21D exponential moving averages (“EMA”) are rising with 21D EMA forming golden crosses with 50D and 100D EMA. A sustained breach above its 200D EMA (currently at 2,863) is very positive. It is noteworthy that STI has not traded above its 200D EMA since 2 Jun 2015. To be clear, my usual definition for sustained breach is approximately one week. In other words, the index has to sustain the breach consistently for approximately one week. However, for the STI, to prevent any false breakouts, it should consistently sustain the breach above its 200D EMA for two straight weeks.
Near term supports: 2,831 / 2,814 / 2,804 – 2,806
Near term resistances: 2,863 / 2,882 / 2,900
Chart 3: STI – a sustained breach above its 200D EMA is positive
Source: CIMB chart as 8 Jul 2016
FTSE ST Small Cap Index (“FSTS”)
On 24 Jun 2016, I wrote that “FSTS looks bearish and weaker than STI. The bearish tinge is negated if FSTS can climb above 391 on a sustained basis.”
–> FSTS is indeed weaker than STI. It only rebounded 10 points or 2.6% from 379 on 24 Jun 2016 to close 389 on 8 Jul 2016.
Based on Chart 4 below, ADX has declined from 24.3 on 24 Jun 2016 to 19.7 on 8 Jul 2016. Except for 21D EMA which has started to turn higher, the other EMAs are still trending lower. All in, FSTS looks bearish and weaker than STI. The bearish tinge is negated if FSTS can climb above 393 on a sustained basis.
Near term supports are at 388 / 386 / 383
Near term resistances are at 391 / 393 / 399 – 401
Chart 4: FSTS – looks weaker than STI
Source: CIMB chart as 8 Jul 2016
Conclusion
I received emails from well-meaning readers who cautioned me from taking excessive risk, especially after they read my market outlook dated 24 Jun. [I said that I may raise my percentage invested to 150 – 200% on sharp sell offs. I wish to thank them for reading my write-up and taking the time to drop me an email.]
I have raised my percentage invested from 71% on 24 Jun 2016 to 76% on 8 Jul 2016 by buying more into stocks which I already hold. In fact, one of the stocks occupies around 30% of my unleveraged portfolio. The reasons why I didn’t increase my percentage invested (i.e. more than 76% invested) are as follows:
A) The stocks which I am looking at did not fall excessively hence I did not buy aggressively;
B) I had a business (site visit) trip planned from 4 – 6 Jul 2016 hence I am not comfortable to be too heavily invested, especially if I am unable to monitor the shares. Furthermore, due to time constraints, I did not have time to research into two other stocks hence I wasn’t able to accumulate them;
C) The actual percentage invested should be higher. However, my calculation takes into account of the market value of the shares in my portfolio. Some of these shares have risen approximately 5 – 10% in the past two weeks;
With the record closing in the S&P500, I am unlikely to raise my percentage invested to > 125% (unless I spot some extremely attractive opportunities). Even so, I am unlikely to be invested >125% for prolonged periods. I believe we should be more cautious in the next couple of months because
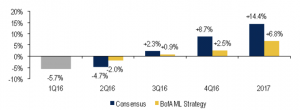
A) Upcoming 2Q results from the U.S corporates are unlikely to be inspiring. Based on Chart 5 below, U.S. companies are likely to report another quarter of negative year on year growth, the fifth time in a row. Unless the U.S. corporates give a glowing 2H2016 outlook, it is difficult for the market to make new highs amid an earnings recession;
Chart 5: 2Q is likely to be the 5th consecutive quarter registering a y/y decline
Source: Bank of America Merrill Lynch, Yahoo Finance
B) According to FactSet, S&P500’s forward PE is around 16x which is higher than its 5 year and 10 year averages. The relatively high valuations are also exacerbated by negative earnings growth;
C) For the past four decades, there was only once when S&P 500 has closed at a record high and the 10-year treasury yield has closed below 2%. Typically, stocks and bonds (i.e. 10 year note) do not move in the same direction over prolonged periods. This is because bonds typically do well when risk appetite is low and stocks perform well amid high risk appetite. Personally, it is likely that one of them is likely to give in the next couple of months (i.e. the usual inverse relationship should resume over time).
Notwithstanding the above, although I am cautious on the overall market (especially the U.S. market), I am still positive on some Singapore listed stocks with near term catalysts and will continue to accumulate them. As I have always said, there are always opportunities in the market. (My clients have, will & are informed on new stocks which I have entered and any significant portfolio change.)
Readers who wish to be notified of my write-ups and / or informative emails, can consider signing up at http://ernest15percent.com. However, this reader’s mailing list has a one or two-day lag time as I will (naturally) send information (more information, more emails with more details) to my clients first. For readers who wish to enquire on being my client, they can consider to leave their contacts here http://ernest15percent.com/index.php/about-me/
Lastly, many new clients have asked me how I screen and decide which companies to take a closer look / write. To understand more about my basis of deciding which companies to write, you can download a copy of my eBook available on my website HERE.
P.S: Do note that as I am a full time remisier, I can change my equity allocation fast to capitalize on the markets’ movements.
Disclaimer
Please refer to the disclaimer HERE


From Macro to Micro
How about coming up with 3 conviction buys in the Small cap space in Singapore?
In my view,there is still value to be found there, if you are prepared to dig, accept illiquidity And wait.
PGL
Hi Peter,
Good to hear from you. I try not to put in specific conviction buys on my blog. However, my clients will know what i hold, esp if the stock forms a large percentage of my portfolio.
I share the same view as you. There are always opportunities, as long as, we put in effort to search for such opportunities.
Have a gd week ahead.