Dear all
Since my write-up on 23 Dec 2018 (see HERE), S&P500 has jumped approximately 7.5% since then. In fact, S&P500, after touching an intraday low of 2,347 on 26 Dec 2018, it has risen 249 points or 10.6% to close 2,596 on 11 Jan 2019.
Is this the start of another upcycle in equities? Should we chase the rally?
Below are some of the positive and negative points which readers can take into consideration before we can arrive to a well thought out answer.
Potential positive points supporting the continuous rally
a) Fed may acknowledge rising risks to their interest rate hike and shrinking of balance sheet (which Fed Chair Powell said on 4 Jan 2019 that he will be flexible on interest rate);
b) Most U.S. upcoming corporate results to be stronger than expected. We should have a glimpse this week as Bank of America, Citigroup, Goldman Sachs, JP Morgan, Netflix and Wells Fargo are expected to report results;
c) Resolution of U.S. / China trade;
d) Some idle cash / funds are not invested yet and they are waiting to invest into the market;
e) Equity market valuations have become more palatable after the recent sell-off.
Potential negative points against the continuous rally
a) U.S. indices still in a downtrend;
b) Slowing global economy with data coming out from China, Europe etc. Even U.S. is not spared with some indicators such as ISM Manufacturing / Non-Manufacturing data missing estimates;
c) Currencies exhibiting weird movements (e.g. JPY flash crash on 2 Jan);
d) U.S. Companies may slash their guidance for 2019 (if they do so, we should know in the next few weeks. My personal view is that Apple is not the only isolated case to warn of slowing sales);
e) U.S. Fed may not slow their actual rate path (since they are data dependent), even though they acknowledge flexibility in rates;
f) Political problems at U.S. as Democrats take over Congress. The current partial government shutdown (likely to be the longest in history – read HERE) is a case in point as Democrats clash with President Trump;
g) U.S. / China meeting on 7-8 Jan may not yield concrete follow through results;
h) More news on U.S. trade front against China or / and other countries e.g. EU and Japan;
i) U.S. yield curve has been pretty flat with the spread between the 2Y and 10Y Treasury yields at 16 basis points last Fri. There may be some adverse market reactions should this yield curve invert;
j) Developments over Brexit;
What do the charts say?
S&P500 chart
Background: S&P500 has broken the short-term uptrend line established since Oct 2018 and the long-term uptrend line established since Feb 2016. Except for 20D exponential moving averages (“EMAs”), all other EMAs (which I use) are trending lower with death cross formations. After touching the intraday low of 2,347 on 26 Dec 2018, S&P500 has risen 249 points or 10.6% to close 2,596.
ADX closed 25.2 on 11 Jan 2019 amid negative placed directional indicators (“Dis”), indicative of a trend. RSI closed at 53.5 on 11 Jan 2019. MFI closed at 69.4 on 11 Jan 2019. MACD has rebounded from a 10-year low of -77.5 on 24 Dec 2018 to close –16.9 on 11 Jan 2019.
Notwithstanding the sharp 10.6% rally in the past two weeks, S&P500 chart is still bearish, as it has broken both the short-term uptrend line established since Oct 2018 and the long-term uptrend line established since Feb 2016. It faces strong resistance around 2,602 – 2,638. A sustained breach above 2,644 (markets are more volatile now hence needs to give some allowance) with volume expansion negates the bearish short-term downtrend.
Near term supports: 2,574 / 2,555 / 2,532 / 2,487 – 2,490
Near term resistances: 2,596 – 2,602 / 2,616 – 2,620 / 2,638 / 2,644 / 2,670
Chart 1: S&P500 faces strong resistance around 2,602 – 2,638
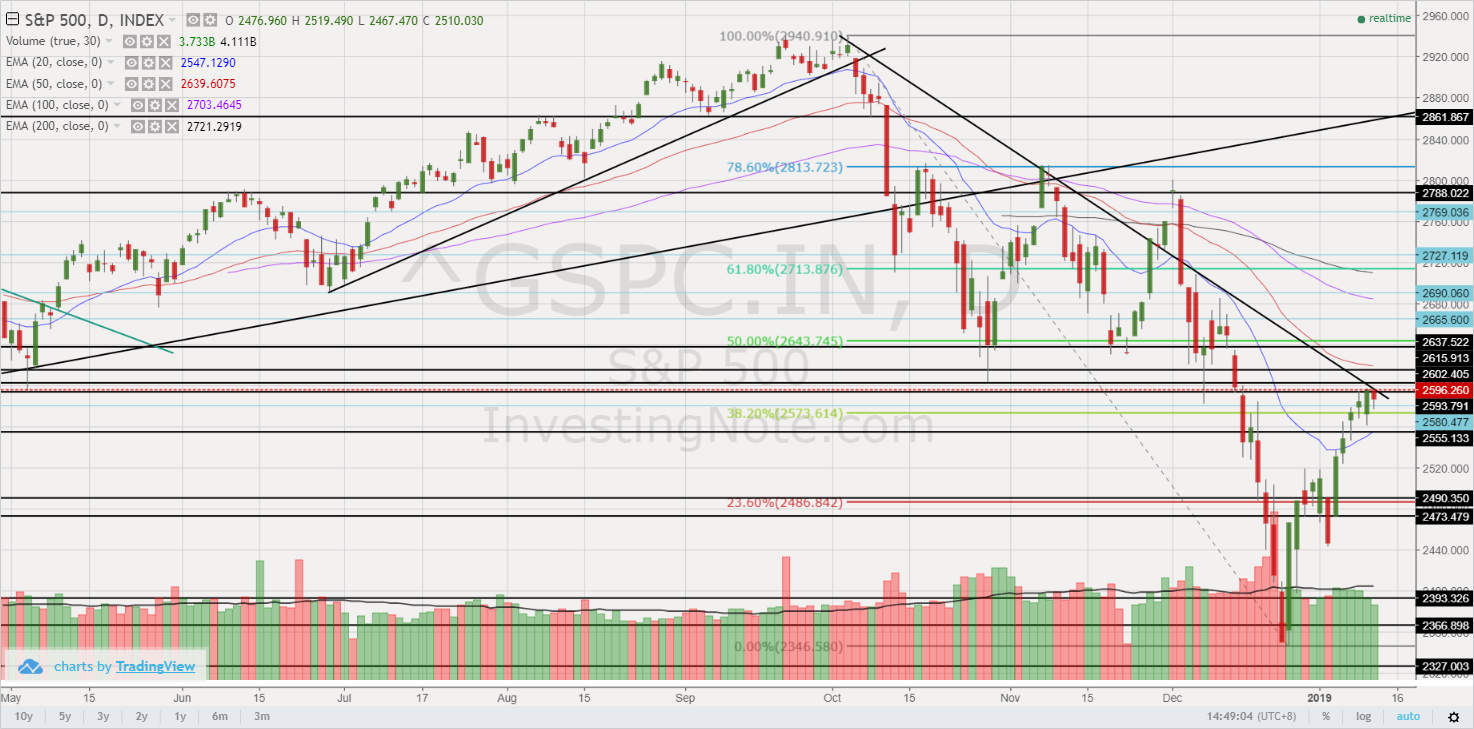
Source: InvestingNote 11 Jan 2019
STI chart
STI has jumped 206 points, or 6.9% from the intraday low of 2,993 on 4 Jan 2019 to close 3,199 on 11 Jan 2019. ADX closed 13.9 on 11 Jan 2019 amid positively placed Dis, indicative of a range bound market. A doji seems to have been formed on 11 Jan 2019 which may signify diminishing buying pressure. Except for 200D EMA which is still falling, other EMAs which I use are rising. 20D is on the verge of forming a golden cross with 50D EMA. However, with the low ADX, the efficacy of the golden cross signal may be less. RSI closed at 65.7 on 11 Jan 2019. There is a possibility that STI may be in the midst of forming a bullish double bottom formation with the neckline at 3,192 – 3,193. However, given the low ADX, doji and the significant resistance area 3,203 – 3,232, this double bottom formation may not be able to succeed on a sustained basis in the near term.
Near term supports: 3,190 / 3,183 / 3,158 / 3,133 – 3,136
Near term resistances: 3,203 / 3,220 / 3,232 / 3,265
Chart 2: STI on the verge of forming a potential double bottom formation, but may not be sustainable
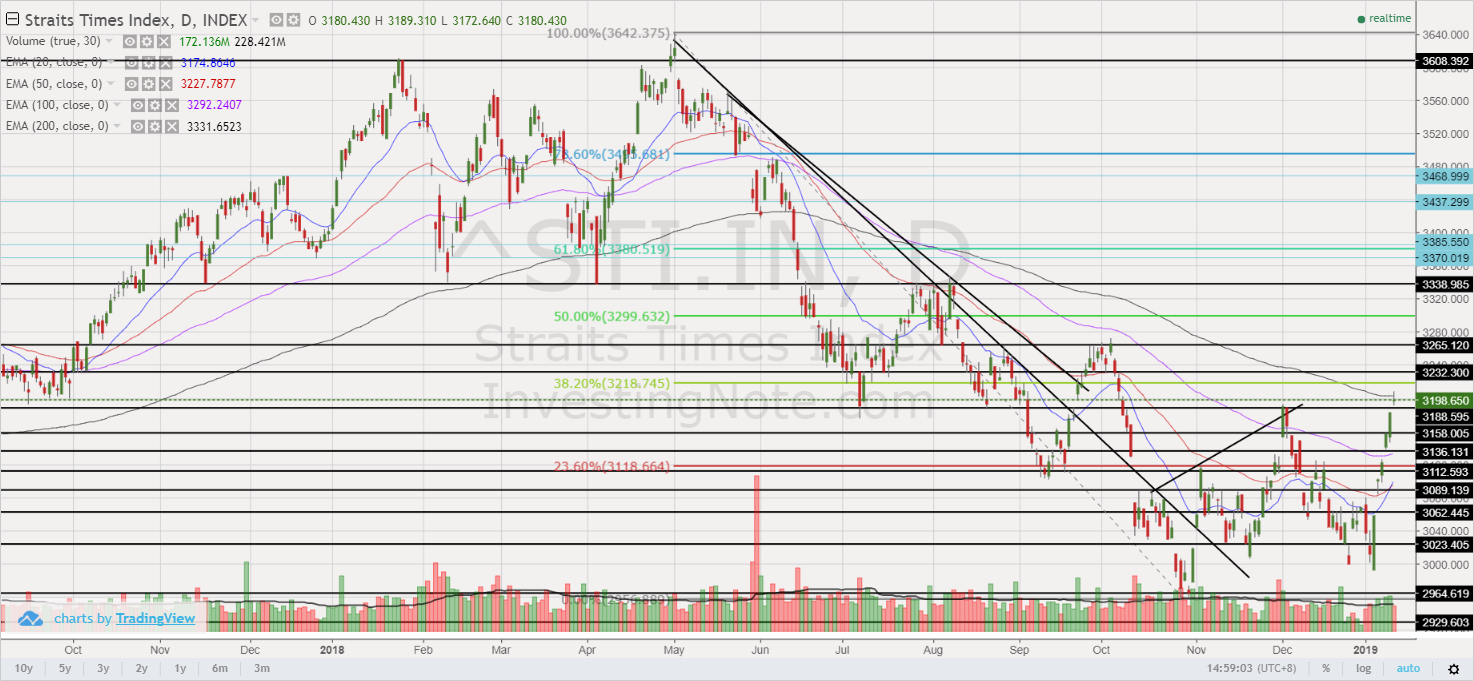
Source: InvestingNote 11 Jan 2019
My personal strategy – sell into strength & may engage in some tactical shorts
Based on the above, it seems like negative views outweigh that of positive points. Markets have jumped last two weeks due to a thaw in tensions between U.S. & China; Fed Chair Powell signals flexibility; and strong jobs reports, I am taking this small rebound to sell on rallies, in view of the above multitude of negative factors.
As my clients are aware, I have raised my % invested aggressively during the period 20-26 Dec 2019 to >220% (with leverage from *CFDs) on 26 Dec 2019. I have already sold most of my positions and have started to engage in some small tactical short positions. My current % invested has dropped to around 30%. I may continue to sell into strength or even engage in more shorts if opportunities arise. I am likely to buy only on weakness, and unlikely to chase on strength, unless there are specific company news to do so or the macro picture has changed significantly to warrant such actions. Please refer to the important caveats below.
*Clients / Readers can refer to CGS-CIMB CFDs (HERE) for more information. My personal view is that cash account and CFD account can complement each other.
Important caveat
Naturally, my market outlook and trading plan are subject to change as charts develop. My plan will likely not be suitable to most people as everybody is different. Do note that as I am a full time remisier, I can change my trading plan fast to capitalize on the markets’ movements (I am not the buy and hold kind). Furthermore, I wish to emphasise that I do not know whether markets will definitely rebound or continue to drop. However, I am acting according to my plans. In other words, my market outlook; portfolio management; actual actions are in-line with one other. Notwithstanding this, everybody is different hence readers / clients should exercise their independent judgement and carefully consider their percentage invested, returns expectation, risk profile, current market developments, personal market outlook etc. and make their own independent decisions.
Readers who wish to be notified of my write-ups and / or informative emails, can consider signing up at http://ernest15percent.com. However, this reader’s mailing list has a one or two-day lag time as I will (naturally) send information (more information, more emails with more details) to my clients first. For readers who wish to enquire on being my client, they can consider leaving their contacts here http://ernest15percent.com/index.php/about-me/
Disclaimer
Please refer to the disclaimer HERE