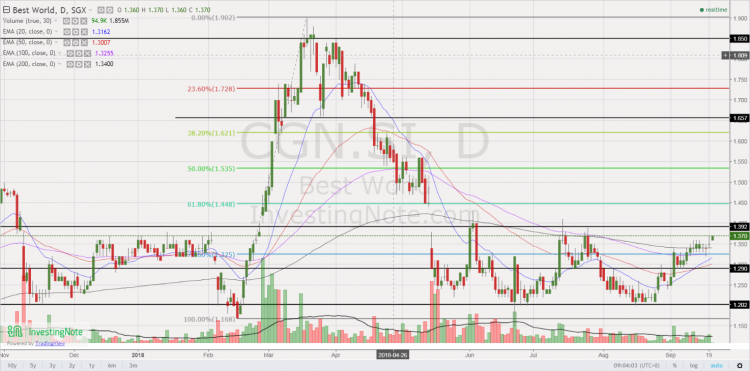
Best World – potential bullish double bottom formation in the making? (19 Sep 18)
This week, Best World has caught my attention. Why is it interesting? a) Chart seems to be in the midst of a double bottom formation Best World has fallen 29% from an intraday high of $1.90 on 19 Mar 2018 to close $1.35 on 19 Sep 2018. It has been trading in a range $1.20 – 1.39 since 15 May 2018. Indicators are mixed with MACD and RSI exhibiting bullish divergences during this period. Except for 200D EMA which is levelling, all other EMAs are rising. 20D has already formed a golden cross formation with 50D EMA. Best World has […]