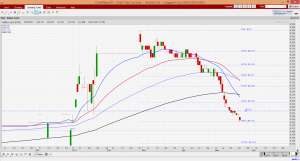
Hatten Land has dropped 39% from an intraday high of $0.300 on 28 Feb 2017 to close $0.183 on 23 May 2017. What has caused the sharp decline? Where is the bottom?
Possible reasons for the decline
Personally, I believe the recent decline may be attributed in part to the following:
a) Hatten reported losses for its 3QFY17 results due mainly to the RM87.8m expenses incurred in relation to the professional fees and acquisition costs arising from the Reverse Takeover exercise (“RTO”). It is noteworthy that these expenses are once off and non-cash in nature [click HERE for Hatten’s 3QFY17 results];
b) Hatten is a proxy to Malacca growth before it expands beyond Malacca. There are fears that the development of Meleka Gateway may be affected with Malaysia’s decision to scrap the sale of a 60 per cent stake in its signature Bandar Malaysia project to a Malaysia-China consortium. However, in a Business Times article dated 18 May 2017, Hatten’s executive chairman and managing director Colin Tan believes that the Melaka Gateway port project is still firmly underway. He believes that the seaport’s completion by 2019 is expected to benefit projects in the vicinity.
It is evident that China is still on the look out for opportunities to invest in Malaysia. Prime Minister Najib recently spent five days in China which culminated in the signing of nine Business-to-Business Memoranda of Understanding in various sectors such as agriculture, as construction, financial market, infrastructure and investment cooperation worth US$22.7bil (RM31.26bil). During the visit, China Prime Minister Li Keqiang reiterated their continual support for Chinese companies to invest in Malaysia.
Chart analysis
Based on Chart 1 below, Hatten seems to be entrenched in a strong downtrend with all exponential moving averages (“EMAs”) trending lower. Death crosses have also formed. Hatten is trading below all its EMAs. RSI is extremely oversold and closed at 15, the lowest since it first announced its RTO on 6 Jun 2016. ADX is at an unsustainable high level of 59. Other indicators such as MFI and MACD are either at depressed or oversold levels. Thus, there is a likelihood that it may stage a rebound in the next few weeks.
Near term supports: $0.181 / 0.170 / 0.161
Near term resistances: $0.195 / 0.205 / 0.215
Chart 1: Extremely oversold with RSI 15
Source: Chartnexus as of 23 May 17
A key point to take note
It is noteworthy that Hatten has slid 39% since the intraday high of $0.300 on 28 Feb 2017 to close at $0.183 on 23 May 2017. There may be some negative news known to the market but unknown to me. Furthermore, oversold conditions can remain oversold for some time. Hence it is good to exercise caution.
Conclusion
This write-up revolves around Hatten’s chart as its extreme oversold nature piques my interests. Readers who wish to know more about Hatten’s fundamentals and business, they can download the following analyst reports, or refer to the following write-ups:
-
UOB Kayhian “Safe harbour in FY18” dated 16 May 17;
- Sharesinvestment “Deep value found within Hatten Land” dated 21 Apr 17 [click HERE];
-
My write-up ““Capitaland” of Malacca” dated 10 Mar 17 [click HERE];
- NRA Capital “Strong pipeline of projects justifies upside” dated 28 Feb 17;
- Lim & Tan “A beneficiary of China Mega Investments into Malacca (Malaysia)” dated 24 Feb 17;
P.S: I am vested in Hatten.
Disclaimer
Please refer to the disclaimer HERE

Major thanks for the blog post.Really thank you! Will read on…
They have a lot of patients and a lot of staff buy cheap cytotec no prescription