Dear readers,
Two weeks ago, I mentioned that I have increased my stock holding from 36% to 80% by accumulating on one stock on weakness. I have since taken profit on this single largest stock holding and have pared my stake in another stock. Besides the stock sales, I have increased my stake in another stock on weakness. All in, my percentage invested was reduced from 80% to approximately 31%.
I am unlikely to exceed 50% invested in the next two weeks, unless I spot some extremely attractive opportunities as I remain cautious on the general market.
Read on to find out why.
S&P500 Index
Just to recap what I have mentioned on 27 May 2016 (see here), I wrote “Given the low ADX, it seems unlikely that S&P500 can make a sustained breach 2,104 – 2,115 in the near term.”
–> Between 6 – 10 Jun 2016, S&P500 traded around the resistance level 2,104 – 2,115 but as expected, it didn’t make a sustained close above 2,115 (S&P500 only closed at or above 2,115 on 7 & 8 Jun). On 10 Jun, S&P500 dropped 0.9% to close at 2,096.
Based on Chart 1 below, although S&P500 made a “higher high” by closing at 2,119 on 8 Jun 2016 vs 2,111 on 20 Apr 2016, indicators such as RSI and MACD exhibited bearish divergences. Furthermore, ADX closed at 20.2. In my opinion, this ADX reading is still neutral and not indicative of a trend. In the next two weeks, it is likely that S&P500 may trade between 2,034 – 2,106 (barring Brexit on 23 Jun 2016)
Near term supports: 2,086 – 2,091 / 2,070 / 2,047
Near term resistances: 2,106 / 2,115 – 2,120 / 2,133 – 2,135
Chart 1: S&P500 likely trades between 2,034 – 2,106

Source: CIMB chart as of 10 Jun 2016
Hang Seng Index
On 27 May 2016, I mentioned that “Hang Seng still has a bearish tinge in the chart. A sustained break above its declining 200D exponential moving average “EMA” (currently at 21,369) will negate the bearish tinge”
–> Hang Seng jumped 2.4%, or 486 points from 20,577 on 27 May 2016 to close 21,043 on 10 Jun 2016. Hang Seng actually touched its 200D EMA on 7 Jun & 8 Jun 2016 but failed to stage a sustained close above it.
Based on Chart 2 below, although Hang Seng has not made a sustained breach above its 200D EMA, the bearish tinge has been negated to a certain extent by the golden crosses formed from its 21D EMA with 50D EMA and 100D EMA. Furthermore, ADX has climbed from 20.5 on 27 May to 25.3 on 10 Jun, indicative of a trend. However, in my opinion, the chart outlook is best described as neutral to mildly positive. It would be a strong positive if Hang Seng can make a sustained breach above its 200D EMA (currently around 21,335). Conversely, it is negative if Hang Seng makes a sustained break below the support area 20,435 – 20,693. It is noteworthy that there is an event risk (among the many risks highlighted below) on 14 Jun 2016 as MSCI will reveal whether they will add mainland-traded Chinese stocks to its global indexes.
Near term supports: 20,845 / 20,556 – 20,693 / 20,335 – 20,435
Near term resistances: 21,335 / 21,638 / 21,900
Chart 2: Hang Seng – neutral to mildly positive

Source: CIMB chart as of 10 Jun 2016
STI Index
On 27 May 2016, I wrote that “STI seems to have staged a bullish break out from this range on 27 May 2016, by closing at 2,803. However, we need a few days to monitor whether the bullish break is on a sustained basis. My personal view is that STI still has a bearish tinge in the chart. It faces strong resistance around 2,791 – 2,825 over the next few weeks. In the unlikely event that it makes a sustained close above 2,825, a more formidable resistance is at its declining 200D EMA, currently at 2,882.
On 9 Jun 2016, I followed up with an email to my clients in the morning (STI was trading at 2,877 then) to alert them that based on chart, STI is unlikely to make a sustained breach above its 200D EMA which was at 2,877 at that time, thus there was limited potential upside.
–> Over the past two weeks, STI broke above 2,825 on 6 Jun 2016 and touched its 200D EMA on 9 Jun 2016 but it failed to breach and closed 0.65% lower on the same day. It weakened further by another 0.7% to close at 2,823 on 10 Jun 2016. Thus, within four trading days, STI fell below 2,825.
Based on Chart 3 below, STI seems likely to trade within a range of 2,713 – 2,882 in the next two weeks. A break below the support area of 2,791 – 2,809 on a sustained basis is negative for the chart. A sustained breach above 2,882 is bullish for the chart.
Near term supports: 2,809 / 2,797 / 2,791
Near term resistances: 2,860 / 2,876 / 2,882
Chart 3: STI – likely trades 2,713 – 2,882 in the next two weeks
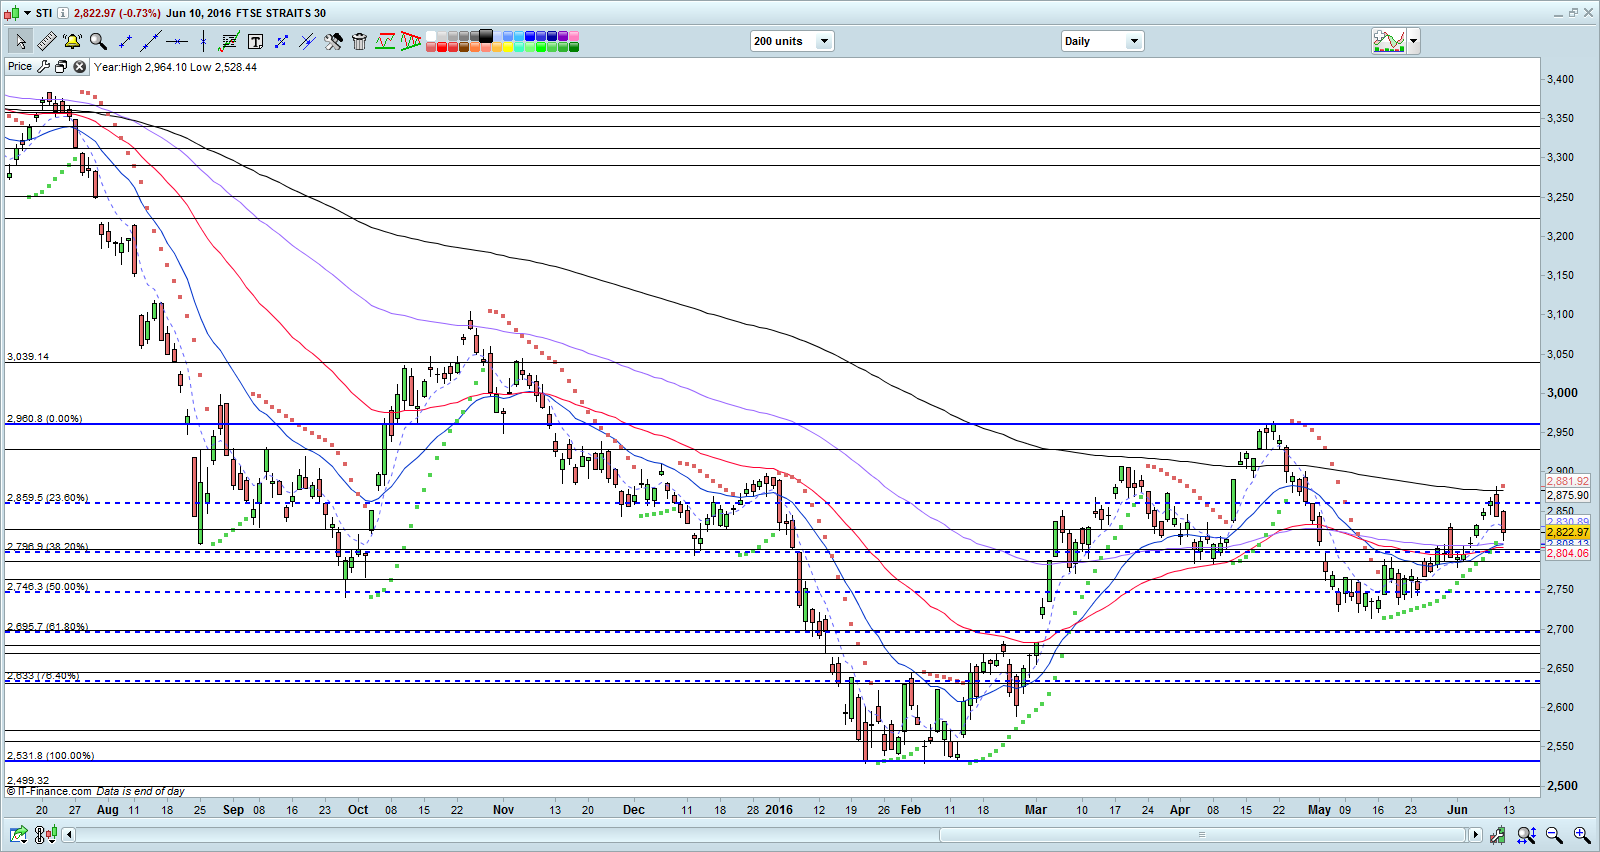
Source: CIMB chart as 10 Jun 2016
FTSE ST Small Cap Index (“FSTS”)
On 27 May 2016, I wrote that “FSTS looks negative since it broke below 391 on 11 May 2016. 21D, 50D, 100D and 200D EMAs continue to trend lower. A sustained break below 391 points to a measured technical target of 377. FSTS seems weaker than STI on a chart basis.”
–> FSTS rose from 390 on 27 May 2016 to touch an intraday high of 399 on 9 Jun 2016 before closing weaker at 395 on 10 Jun 2016.
Based on Chart 4 below, ADX closed at 16.1 on 10 Jun 2016, indicative of a lack of trend. In the next two weeks, FSTS likely trades between 388 – 401. A sustained break below 391 points to a measured technical target of 377. FSTS seems weaker than STI on a chart basis.
Near term supports are at 393 – 394 / 391 / 388
Near term resistances are at 399 / 401 / 409 – 410
Chart 4: FSTS – seems weaker than STI
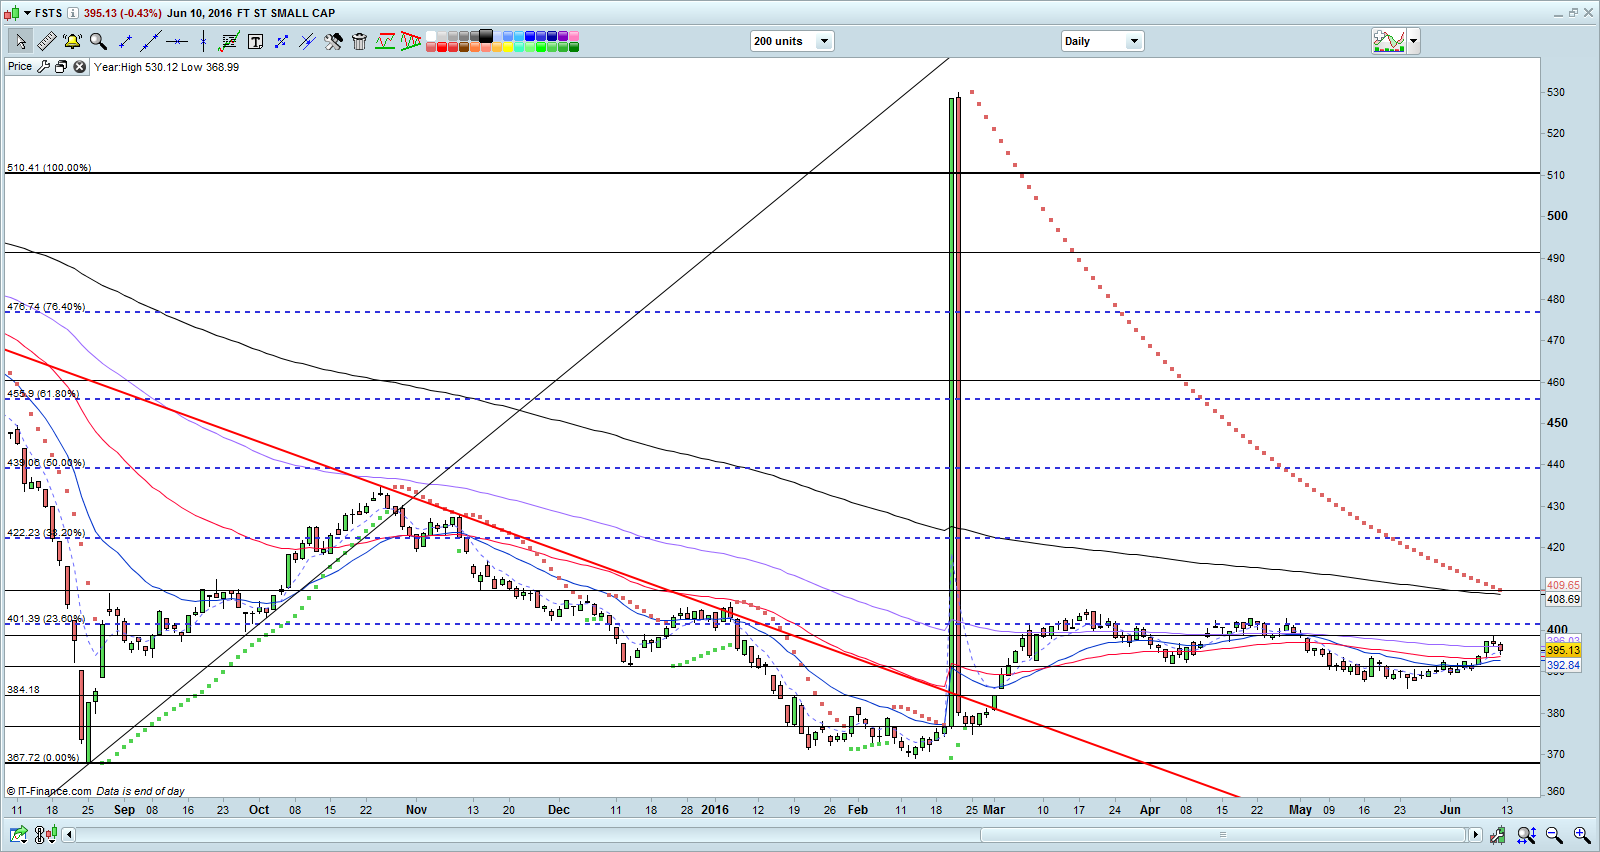
Source: CIMB chart as of 10 Jun 2016
Conclusion
Two weeks ago, I mentioned that I have increased my stock holding from 36% to 80% by accumulating on one stock on weakness. I have since taken profit on this single largest stock holding and have pared my stake in another stock. Besides the stock sales, I have increased my stake in another stock on weakness. All in, my percentage invested was reduced from 80% to approximately 31%. (My clients have, will & are informed on new stocks which I have entered and any significant portfolio change.)
My outlook remains the same. Notwithstanding some specific stocks, I remain cautious on the general market. Some of the factors which cause me to be wary are:
a) MSCI decision on whether to include China into its global indices;
b) Upcoming FOMC meeting on 15 Jun 2016 (we shall know the outcome on 16 Jun, 2 am à Current expectations price in 0% for a rate hike in June but it is good to monitor what the Fed says);
c) Bank of Japan meeting on 16 Jun 2016;
d) UK referendum on 23 Jun 2016. Personally I think the UK referendum is more important than the June FOMC. According to risk-modeling firm Axioma Inc, European stocks may drop by almost a quarter in value should Brexit occur;
Some other factors such as limited catalysts for funds to hold significant equity positions especially when most companies have already reported their results and / OR have gone ex-dividend etc. have been discussed in previous write-up (see here), thus I will not repeat the points here.
In view of the above factors, I am unlikely to exceed 50% invested in the next wo weeks, unless I spot some extremely attractive opportunities.
Readers who wish to be notified of my write-ups and / or informative emails, they can consider to sign up at http://ernest15percent.com so as to be included in my mailing list. However, this reader’s mailing list has a one or two-day lag time as I will (naturally) send information (more information, more emails with more details) to my clients first. For readers who wish to enquire on being my client, they can consider to leave their contacts here http://ernest15percent.com/index.php/about-me/
Lastly, many new clients have asked me how I screen and decide which companies to take a closer look / write. To understand more about my basis of deciding which companies to write, you can download a copy of my eBook available on my website here.
P.S: Do note that as I am a full time remisier, I can change my equity allocation fast to capitalize on the markets’ movements.
Disclaimer
Please refer to the disclaimer here