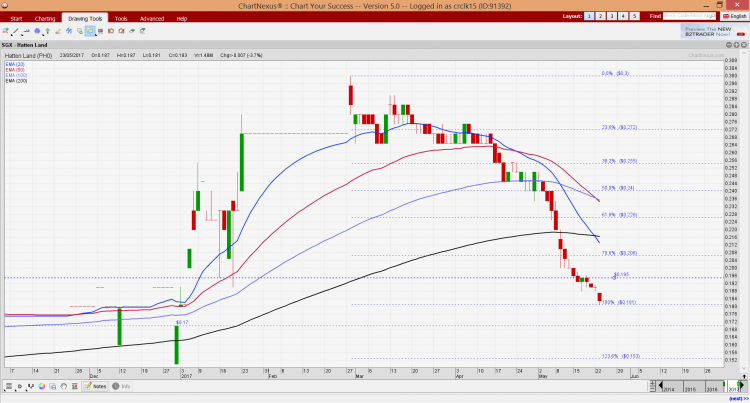
Hatten Land – extremely oversold RSI 15; Analyst TP: $0.435 vs closing price $0.183 (23 May 17)

Hatten Land has dropped 39% from an intraday high of $0.300 on 28 Feb 2017 to close $0.183 on 23 May 2017. What has caused the sharp decline? Where is the bottom?   Possible reasons for the decline Personally, I believe the recent decline may be attributed in part to the following: a) Hatten reported losses for its 3QFY17 results due mainly to the RM87.8m expenses incurred in relation to the professional fees and acquisition costs arising from the Reverse Takeover exercise (“RTO”). It is noteworthy that these expenses are once off and non-cash in nature [click HERE for Hatten’s […]

Hatten Land Limited – “Capitaland” of Malacca (10 Mar 17)

For those who have gone to Malacca, they may have seen some of the developments by Hatten Land. Some may have gone as far to say that Hatten Land in Malacca may be considered as our “Capitaland” (to some extent) in Singapore. For those who are not familiar with Hatten Land, below is a short write-up.   Company description Hatten Land is the property development arm of the conglomerate Hatten Group with business in property development, property investment, hospitality, retail and education. Based on their circular, Hatten Land’s core business (See Table 1 below), is to sell all developed units […]

CWG chart looks strong, despite price consolidation (27 Dec 16)

CWG International Limited (“CWG”), former Chiwayland, closed unchanged at $0.156 on 27 Dec 16. Based on Chart 1 below, notwithstanding the recent price consolidation, all its exponential moving averages (“EMAs”) are still rising strongly, indicative of an uptrend. OBV is at elevated levels despite the price consolidation (i.e bullish). Amid positively place directional indicators, ADX is around 25, indicative of a trend. RSI closed at 56. Although the usual benchmark for RSI’s overbought level is around 70, it is noteworthy based on historical records, its RSI can reach 90 before profit taking occurs. All in, the chart looks positive. A […]

Chiwayland – potential upside chart breakout (4 Nov 16)

Chiwayland has dropped from an intraday high of $0.177 on 10 Oct 2016 to trade to an intraday low of $0.151 on 2 Nov 2016. It closed at $0.162 on 4 Nov 2016. Based on Chart 1, Chiwayland seems to have staged an upside breakout above $0.157 on strong volumes, the highest since 11 Oct 2016 (which coincided with the date of UOB Kayhian’s unrated report – see below). All the exponential moving averages (“EMAs”) are rising which indicate an uptrend. Although ADX is declining, it is still at elevated area at around 39 with positive placed directional indicators, indicative […]