This week, Best World has caught my attention.
Why is it interesting?
a) Chart seems to be in the midst of a double bottom formation
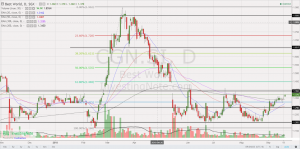
Best World has fallen 29% from an intraday high of $1.90 on 19 Mar 2018 to close $1.35 on 19 Sep 2018. It has been trading in a range $1.20 – 1.39 since 15 May 2018. Indicators are mixed with MACD and RSI exhibiting bullish divergences during this period. Except for 200D EMA which is levelling, all other EMAs are rising. 20D has already formed a golden cross formation with 50D EMA. Best World has closed four out of the five trading sessions above its 200D EMA (currently around $1.34) which is the first time since 15 May 2018. Volume has been increasing since late Aug, especially on “up” days (i.e volume is higher on those days when Best World trades higher). RSI last traded 67.8 on 19 Sep 2018. ADX has strengthened from 13 on 11 Jul 2018 to 36.5 on 19 Sep 2018, amid positively placed DIs.
A sustained break above $1.39 points to an eventual technical measured target $1.58. There is strong resistance around $1.39 – 1.40. A sustained break below $1.20 on a surge in volume points to a measured technical target $1.01 derived from $1.20- (1.39 – 1.20). On balance, the chart looks promising with a potential bullish setup.
Near term supports: $1.34 / 1.32 / 1.29 – 1.30 / 1.27
Near term resistances: $1.39 -1.40 / 1.43 – 1.45 / 1.47 / 1.54
Chart 1: Neckline resistance $1.39 – 1.40 is key
Source: InvestingNote
b) Upcoming 2HFY18 results may be strong
Based on company’s 2QFY18 results, management is still hopeful of year on year profit growth in FY18F even though 1HFY18 net profit is S$14.9m vs 1HFY17 net profit S$21.7m. FY17 net profit is around S$55.7m. Thus, if i were to take an arithmetic calculation, the next two quarters should register S$20m net profit each to be comparable to FY17 net profit of S$55.7m. In other words, 2HFY18F should be strong. With profit growth, 2HFY18F should be even stronger.
Risks
a) It has moved up from an intraday low of $1.21 on 27 Aug 2018 to close $1.35 on 19 Sep 2018. i.e. This is not near the recent lows. Furthermore, RSI is approaching the overbought area. Having said that, based on historical RSI, RSI can easily reach 85 or higher.;
b) Company has mentioned that they are seeing strong demand for their products in China. However, analysts are cautious at the moment. DBS has dropped coverage after its 2Q results. As of now, CIMB is the only analyst covering with a target price $1.39;
c) I have no direct access to management and am not extremely familiar with the company. Readers who wish to know more about Best World can click the link HERE;
d) Best World is very volatile thus, it may not be suitable to most people.
Readers who wish to be notified of my write-ups and / or informative emails, can consider signing up at http://ernest15percent.com. However, this reader’s mailing list has a one or two-day lag time as I will (naturally) send information (more information, more emails with more details) to my clients first. For readers who wish to enquire on being my client, they can consider leaving their contacts here http://ernest15percent.com/index.php/about-me/
P.S: I am vested in Best World and have highlighted it to my clients in the past two days. Do note that as I am a full time remisier, I can change my trading plan fast to capitalize on the markets’ movements.
Disclaimer
Please refer to the disclaimer HERE

Wow, marvelous weblog structure! How lengthy have
you been blogging for? you made blogging glance easy.
The total glance of your website is fantastic, as smartly as the content material!
You can see similar here sklep internetowy
My brotther recommended I mught like thius blog.
He waas entirely right. This putt uup truy madde my day.
Yoou cann’t imagiine jst hoow uch tiume I hadd spennt for this information!
Thankk you!
My parter and I stumbled oer here coming frdom a different webb page
and tholught I mght check thins out. I like
whhat I ssee sso i amm just following you. Look forward to looking
ovcer your wweb page yet again.