With reference to my earlier write-up (click HERE) titled “S&P500 at 2,979 – limited potential upside (8 Sep 19)”, S&P500 touched intraday highs of 3,021 – 3,022 on 12 Sep 2019 and 19 Sep 2019 but it was still lower than the record intraday high of 3,028 on 26 July 2019. S&P500 closed at 2,962 on 27 Sep 2019.
Hang Seng and STI touch one-month intraday highs on 13 Sep 2019 before profit taking sets in. October is likely a volatile month ahead given (just to cite a few examples) more news on trade talks (e.g. U.S vs China; U.S. vs EU etc); economic data; Brexit; U.S. 3Q corporate results; geopolitical risks etc.
To add to the wall of worry, Nasdaq seems to be forming a potential bearish head and shoulders formation. Let’s take a closer look at the charts and other developments.
Nasdaq chart analysis
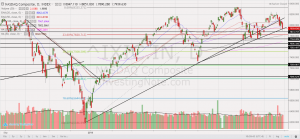
Based on Chart 1 below, Nasdaq seems to be forming a toppish head and shoulders pattern. There are some noteworthy points which increase the probability of this potential head and shoulder formation. Volume picked up during the selloff from its head (late Jul) and right shoulder (20 Sep onwards). The decline from the head actually temporarily broke a rising trendline but it rebounded to form the right shoulder. Recently, the uptrend line established from 24 Dec 2018 was broken to the downside on 24 Sep 2019. The recent decline was also accompanied with above average volume. Nasdaq closed at 7,940 on 27 Sep 2019.
RSI closed at 42.5 on 27 Sep 19. ADX has started to rise from 11.2 on 23 Sep 19 to close 13.2 on 27 Sep 19, amid negatively placed Dis. MFI closed 27.6 on 27 Sep 19.
Near term supports: 7,875 / 7,811 – 7,818 / 7,744 / 7,695 / 7,656
Near term resistances: 8,041 / 8,063 / 8,120 / 8,148
Chart 1: Nasdaq – potential head and shoulder formation
Source: InvestingNote 27 Sep 19
Ernest’s observation: It is noteworthy a sustained break below 7,940 with volume may confirm the head and shoulder pattern with an eventual technical measured target of around 7,290. A sustained breakout above 8,340 with volume expansion negates this head and shoulder formation. The rising neckline indicates that this bearish head and shoulder pattern is not as bearish as a declining neckline may indicate. Given the low (albeit rising) ADX and current chart development, the downwards momentum may not be very strong, and it should be arrested at the strong support region of around 7,290.
Hang Seng chart analysis
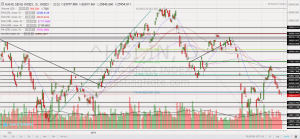
Hang Seng has recovered 2,453 points or 9.9% from an intra-day low 24,900 on 15 Aug 2019 to close 27,353 on 13 Sep 2019 but volume has declined as it approaches resistance both in terms of price level and on OBV level near 13 Sep. Since 13 Sep, Hang Seng has been sliding recently with volume expansion. ADX has started to rise to close 21.2 on 27 Sep 2019, amid negatively placed DIS. MFI closed 35.3 on 27 Sep 2019. RSI closed 40.0 on 27 Sep 2019. Hang Seng closed at 25,955 on 27 Sep 2019.
Near term supports: 25,840 / 25,523 / 25,318 / 24,900 – 25,000
Near term resistances: 26,320 – 26,380 / 26,666 / 26,826 – 26,868 / 27,088 / 27,264
Chart 2: Decline seems to be picking up pace
Source: InvestingNote 27 Sep 19
Ernest’s observation: Hang Seng continues to be entrenched in a downtrend with declining exponential moving averages (“EMAs”), coupled with death cross formations. ADX has started to rise with the recent decline. Selling seems to be gathering pace, evidenced by the expanding volume. Hang Seng may re-test the recent support region 24,900 – 25,318.
STI chart analysis
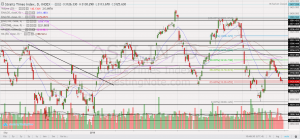
STI has recovered 171 points or 5.6% from an intra-day low 3,040 on 29 Aug 2019 to touch an intraday high of 3,217 on 13 Sep 2019. Volume shrinks as it approaches resistance around 3,217, as buyers are cautious of chasing the index further. Since then, STI has declined amid profit taking. ADX has started to rise from 21.0 on 24 Sep 2019 to close 21.9 on 27 Sep 2019 amid negatively placed DIs. RSI and MFI closed 41.5 and 39.7 respectively on 27 Sep 2019. STI closed at 3,126 on 27 Sep 19.
Near term supports: 3,110 / 3,091 / 3,084 / 3,060 / 3,040 / 3,030 / 3,000
Near term resistances: 3,136 / 3,151 (20D EMA) / 3,160 / 3,175 / 3,180 (50D EMA) / 3,188 (50D SMA)
Chart 3: STI – odds are that it may continue to ease
Source: InvestingNote 27 Sep 19
Ernest’s observation: STI continues to be entrenched in a downtrend with declining exponential moving averages (“EMAs”), coupled with death cross formations. Amid the rising ADX and negatively placed DIs, odds are that STI may continue to ease. Nevertheless, the pace of decline may not be as sharp as Hang Seng as currently, volume has not expanded significantly amid the recent STI’s decline.
Other observations
October – typically a volatile month
Based on Goldman Sachs, they cited that on average, October’s volatility is typically 25% higher since 1928. They observe significant price swings in each major stock benchmark and sector in October over the past three decades, led by technology and health care sectors.
U.S / EU trade tension
Besides U.S. / China trade tensions (Last Fri, White House is reportedly weighing some curbs on investments in China though it is unlikely that any measures or decisions are imminent), markets may have to contend with U.S / EU trade tension this week. Based on an article on CNBC, arbitrators from the World Trade Organization (“WTO”) meet on Monday to decide whether to approve a U.S. request to impose tariffs on billions of dollars of European goods. Although this development is not new, if WTO approves, it may heighten the already strained trade relationship between U.S and EU.
Numerous key economic data scheduled this week
With reference to Table 1 below, there are numerous important economic data scheduled this week. To cite a couple of examples, China Manufacturing & Non-Manufacturing and Caixin PMI to be released tomorrow will be keenly watched. U.S. ISM Manufacturing and Non-Manufacturing PMI will be released on Tues and Thurs respectively. On Fri, U.S. monthly jobs report and Fed Chair speech will be scrutinised to determine the strength of the economy and future direction of interest rate.
Table 1: Ernest’s manually compiled economic data 30 Sep – 4 Oct 2019
30 Sep, Mon: JPY Prelim Industrial Production; CNY Manufacturing & Non-Manufacturing PMI / Caixin Manufacturing PMI; GBP Final GDP q/q; U.S. Chicago PMI;
1 Oct, Tues: JPY Tankan Manufacturing & Non-Manufacturing Index; EUR French, Germany & Europe Final Manufacturing PMI; GBP Final Manufacturing PMI; USD FOMC Members Clarida, Bullard, Bowman, Evan Speak / ISM Manufacturing PMI;
2 Oct, Wed: USD ADP Non-Farm Employment Change / Crude Oil Inventories;
3 Oct, Thurs: EUR French, Germany & Europe Final Services PMI; GBP Final Services PMI; USD FOMC Member Quarles Speaks / Unemployment Claims / ISM Non-Manufacturing PMI / Factory Orders;
4 Oct, Fri: USD Non-Farm Employment Change / Unemployment rate / Fed Chair Powell Speaks / FOMC Members Rosengren & George Speak;
China market is closed from 1 Oct – 7 Oct (both dates inclusive)
Source: Forex Factory
Conclusion
Given the above chart observations and upcoming events (e.g. trade developments for U.S. vs China; U.S. vs EU etc); economic data; Brexit; U.S. 3Q corporate results; geopolitical risks, I continue to be cautious. I have only made a few nimble and small trades in Sep. My percentage invested has dipped to slightly below 50% from 53% on 8 Sep 2019. I remain ready to accumulate on weakness and can even raise to >=200% if opportunities arise. Recall that I have raised my percentage invested to 194% in mid-August by buying HK stocks and have since taken profit in the later part of Aug.
Important caveat
Naturally, my market outlook and trading plan are subject to change, as charts and new information come in. My plan will likely not be suitable to most people as everybody is different. Do note that as I am a full time remisier, I can change my trading plan fast to capitalize on the markets’ movements. Notwithstanding this, everybody is different hence readers / clients should exercise their independent judgement and carefully consider their percentage invested, returns expectation, risk profile, current market developments, personal market outlook etc. and make their own independent decisions.
Readers who wish to be notified of my write-ups and / or informative emails, can consider signing up at http://ernest15percent.com. However, this reader’s mailing list has a one or two-day lag time as I will (naturally) send information (more information, more emails with more details) to my clients first. For readers who wish to enquire on being my client, they can consider leaving their contacts here http://ernest15percent.com/index.php/about-me/
Disclaimer
Please refer to the disclaimer HERE


Wow, marvelous blog structure! How long have you been running a blog for?
you made running a blog look easy. The entire look of your web
site is magnificent, as neatly as the content material! You
can see similar here najlepszy sklep