Dear all,
It has been an extremely busy and hectic period with the U.S. indices clocking in their largest record weekly percentage drop last week.
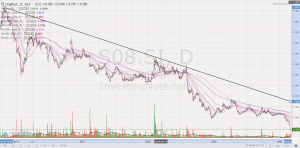
This week, Singpost caught my attention. Singpost has fallen 17.4% from its intraday high of $0.950 on 3 Jan 2020 to close at $0.785 today which is the lowest close since 5 May 2009. RSI closes at a grossly oversold level 10.7, almost at an all-time low last seen in June 2003.
Why does it attract my attention? Read on for more.
Chart – Seems to indicate selling pressures may ease in the near term
Based on Chart 1 below, Singpost is entrenched in a downtrend, evidenced by the declining downtrend line. All the exponential moving averages (“EMAs”) are trending lower with death cross formations. However, two interesting developments caught my attention.
a) A doji forms today with above average volume
A doji forms today on Singpost’s chart. A doji is typically considered a potential bullish reversal pattern that follows a steep decline. However, for this pattern to be more robust, it should be accompanied by a long white candle with volume expansion. Let’s see how Singpost performs in the next few days.
b) RSI closes at grossly oversold level at 10.7
Singpost’s indicators are near multi year lows. For example, Singpost’s RSI closes at 10.7 on 2 Mar 2020. Since June 2003, there is only one occasion where RSI is lower than 10.7 with the lowest RSI at 9.8. MFI closes at 5.6 on 2 Mar 20 which is also near the multi-year low levels of around 3.1. Although there is no rule to stipulate that RSI cannot go below 10.7, suffice to say that, on the balance of probabilities, near term downside may be capped as oversold pressures build.
Near term supports: $0.785 / 0.775 / 0.765
Near term resistances: $0.810 / 0.825 / 0.845
c) ADX closes 55.1, approaching unsustainable levels
With the relentless drop in Singpost’s share price, ADX has been creeping higher and closes at 55.1 on 2 Mar 2020. Although this is not the highest ADX recorded for Singpost, ADX at 55.1 is rather high on an absolute basis and may not be sustainable.
Chart 1: Singpost has fallen 17.4% since 3 Jan 2020
Source: InvestingNote 2 Mar 2020
Analysts are positive
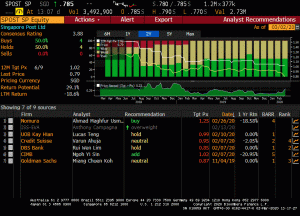
Based on Figure 1 below, average analyst target is around $1.02. Estimated dividend yield is around 4.6%. At today’s closing price of $0.785, this represents a total potential return of around 34.5%!
Figure 1: Average analyst target $1.02; total potential return 34.5%!
Source: Bloomberg 2 Mar 20
Valuations
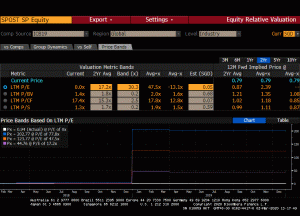
Based on Figure 2 below, Singpost is trading at 1.4x P/BV which is approximately two standard deviations to its two-year average P/BV of around 1.8x. In addition, it is also trading below its 5Y and 10Y average P/BV of around 2.5x and 4.6x respectively.
Figure 2: Singpost’s current and historical valuations
Source: Bloomberg 2 Mar 20
Risks
As with most companies, there are numerous risks that Singpost faces. Just to cite a couple of risk factors (readers can refer to the analyst reports HERE for more risks that Singpost faces)
a) Continues to experience a decline in domestic mail due to electronic substitution
This is a structural trend and will likely affect Singpost to some extent at least over the next few quarters.
b) Covid 19 – has limited impact so far but…
According to the various analyst reports, it was cited that Singpost has not seen any material impact to its operations. However, if Covid 19 drags on, it may affect trade and freight forwarding demand which will adversely affect Singpost.
Conclusion
Singpost captures my attention due to its extremely oversold nature, below average valuations, coupled with an attractive potential capital upside and good dividend yields. However, it is noteworthy that its businesses continue to face headwinds.
Notwithstanding the above, it is noteworthy that I am neither familiar with Singpost’s fundamentals, nor do I have direct access to management (as my main basis is more on its chart). Readers who are interested in Singpost should view Singpost’s announcements on SGX or on their website. Furthermore, you can view the analyst reports HERE.
P.S: I am vested in Singpost shares on a trading basis.
Disclaimer
Please refer to the disclaimer HERE


Hi there ,danke for this article. great