Dear all,
Dow has hit daily highs for 11 consecutive sessions, its longest streak of records since 1987!
What’s next for our markets?
S&P500
Just to recap what I have mentioned on 10 Feb 2017 (see HERE), I wrote “various indicators such as RSI, MACD, OBV and MFI continue to exhibit bearish divergences. ADX has slid from 41 in Dec 2016 to close at around 18 on 10 Feb 2017, which is indicative of a trendless market. RSI closed at 70 on 10 Feb 2017. Given the various chart indications, although S&P500 continues to be on an uptrend amid rising exponential moving averages (“EMAs”), I reiterate that S&P500 may have limited potential upside with resistance 2,300 – 2,325. It is unlikely to make a sustained close above 2,325 in the near term.”
–> I was wrong. S&P500 marched to a record close at 2,367 on 24 Feb 2017.
Based on Chart 1 below, S&P500 continues to be entrenched in an uptrend, as evidenced by its rising EMAs. ADX started to rise from 18 on 10 Feb 2017 to 34 on 24 Feb 2017, indicative of a trend. RSI closed at 80 on 24 Feb 2017. It is noteworthy that RSI only crosses above 80 on a couple of trading sessions in the past three years. Furthermore, based on RSI and MACD, S&P500 is overbought. Although S&P500 has crossed above 2,325 (which I previously mentioned it is unlikely to make a sustained close above), I am very cautious on S&P500 in the near term as the odds of a profit taking increase vis-à-vis two weeks ago.
Near term supports: 2,351 / 2,325 – 2,328 / 2,300
Near term resistances: 2,375 / 2,400 / 2,425
Chart 1: S&P500 has surged approx. 11% since 8 Nov 2016
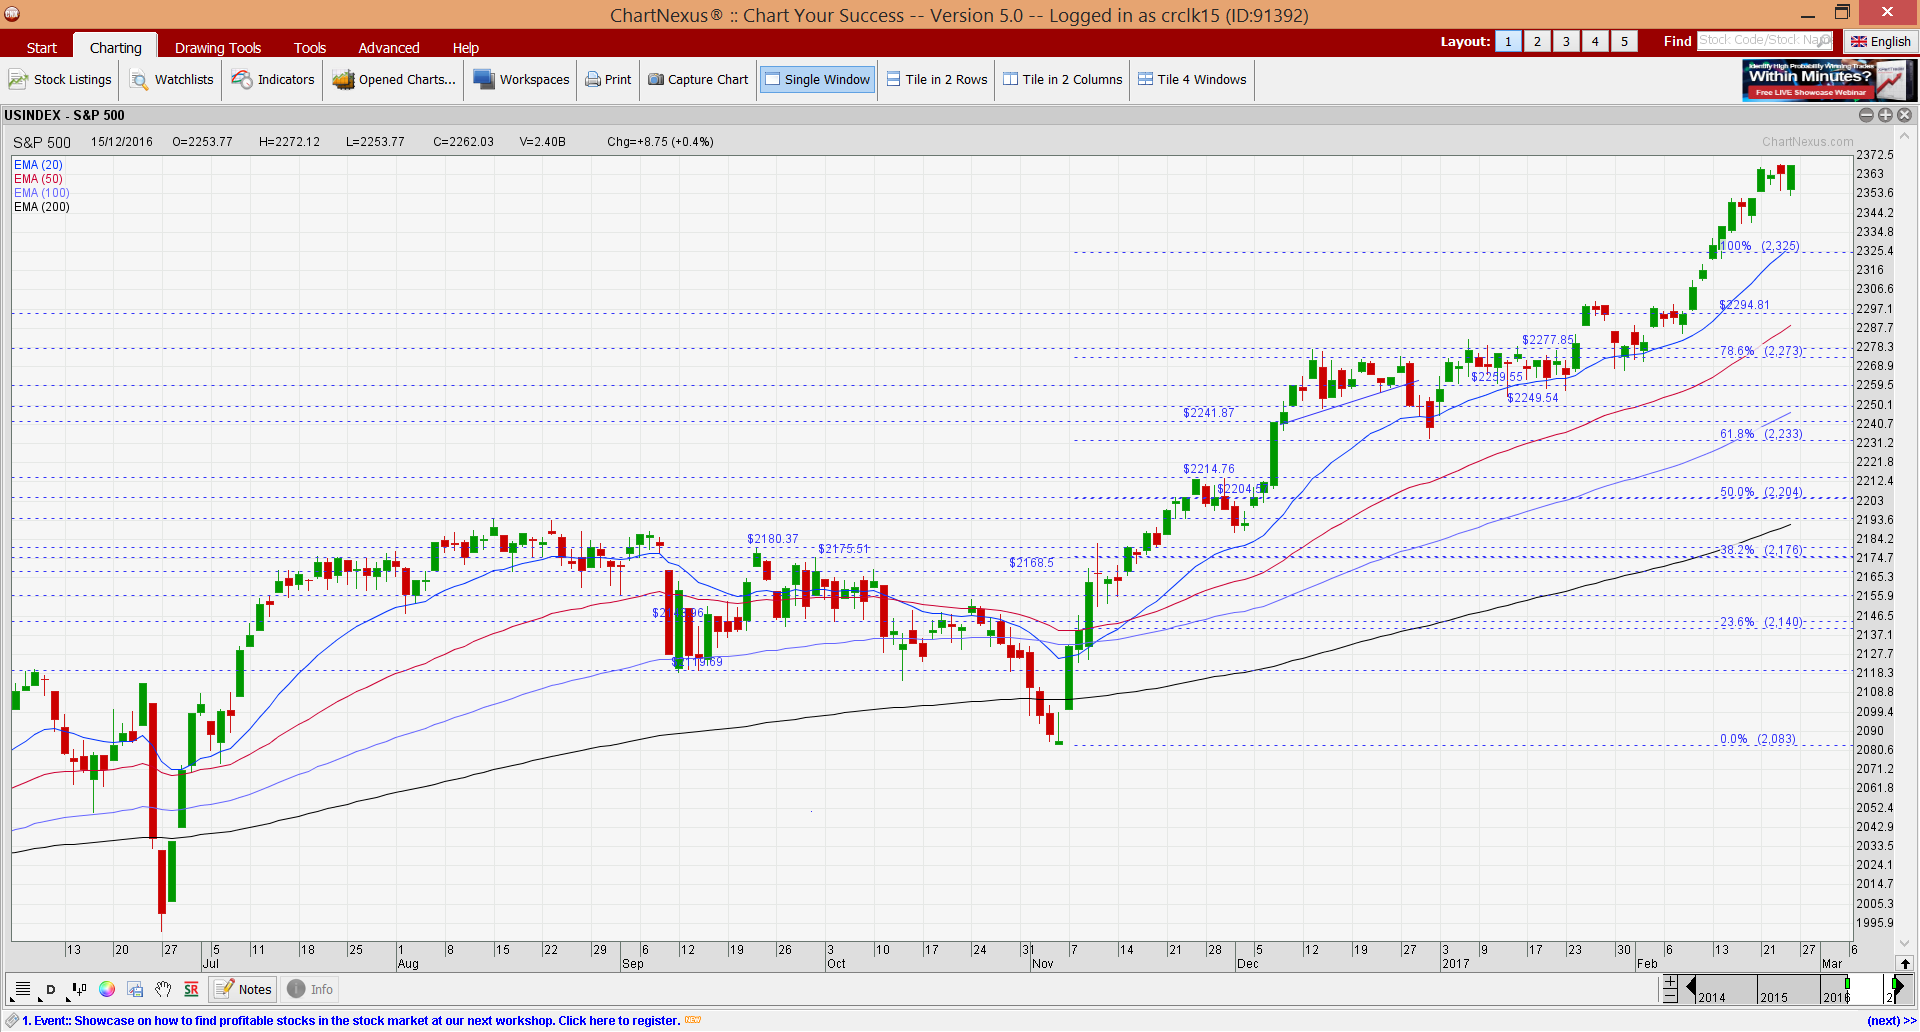
Source: Chartnexus chart as of 24 Feb 2017
Hang Seng Index
Based on my write-up on 10 Feb 2017, I mentioned that “Hang Seng’s chart continues to look more promising than S&P500. This is due in part to the absence of bearish divergences from the indicators such as RSI, MACD, OBV etc. Furthermore, amid positive placed DIs, ADX has risen from 24 on 27 Jan 2017 to close 28 on 10 Feb 2017. Hang Seng’s EMAs continue to rise with 20D EMA forming golden crosses with 50D, 100D and 200D EMA. RSI closed at around 70 on 10 Feb 2017. Except for one period around Sep 2016 where RSI hit 80, it does not usually exceed the low 70s since May 2015.”
–> Hang Seng continues to be bullish and rose 391 points, or 1.7% from 23,575 on 10 Feb 2017 to close 23,966 on 24 Feb 2017 (near my previously mentioned resistance of around 23,930).
Based on Chart 2 below, Hang Seng’s chart continues to be on an uptrend as evidenced by its rising EMAs. Amid positive placed DIs, ADX has risen from 28 on 10 Feb 2017 to 37 on 24 Feb 2017, indicative of a trend. Indicators such as RSI, OBV have started to exhibit bearish divergences. After touching a high of 78 on 16 Feb 2017, RSI has slid and close at 62 on 24 Feb 2017.
As previously mentioned, bearish divergences or overbought / oversold are not immediate sell signals. Overbought and oversold conditions can persist for some time. They should be used in conjunction with other indicators.
Near term supports: 23,950 / 23,730 / 23,562
Near term resistances: 24,100 -24,135 / 24,364 / 24,500
Chart 2: Hang Seng’s bearish divergences emerge

Source: Chartnexus chart as of 24 Feb 2017
STI
Amid the various factors which I pointed out in my 10 Feb 2017 write-up, STI’s risk – reward is generally not favourable for long positions. Readers who are extremely nimble may be able to get a few bids of profit here and there. However, they have to be fast to exit long speculative positions, should the tide turn.”
–> STI rose 0.5% for the past two weeks and closed at 3,117.
Based on Chart 3 below, STI’s chart continues to be on an uptrend. However, there seems to be some cautionary signs that the risk to reward ratio is not favourable for long positions, except for the nimble. Firstly, indicators such as MACD, MFI, RSI continue to exhibit bearish divergences. Secondly, most STI component stocks have already released their results, thus there may arguably be less catalysts to hold on to these stocks as the dividends may only be ex in the next two to three months. Thirdly, with the STI being up 236 points year to date making it one of the best performing stock markets, there seems to be some inflows to selective small mid cap laggard stocks.
Near term supports: 3,100 / 3,084 / 3,064
Near term resistances: 3,148 / 3,161 / 3,215
Chart 3: STI – reiterate risk reward not favourable for long positions, except for the nimble

Source: Chartnexus chart as of 24 Feb 2017
Conclusion – “stock rotation” still in play
As per my write-up on 10 Feb 2017, I mentioned that the recent market trend is “stock rotation”. Since 10 Feb 2017, I have cut loss on my short positions and took profit on some long positions. I have also increased my overall percentage invested from below 50% to 103% in the past two weeks so as to buy / switch into certain small mid cap stocks in anticipation of possibly good set of results to be announced. Such companies are reporting results this coming week.
In the next two weeks, I hope to reduce my overall percentage invested by selling some stocks in the next two weeks. (My clients have, will & are informed on new stocks which I have entered and upon any significant portfolio change.) My personal view is that there may be volatility in March due to the factors below:
a) I continue to be cautious on the overall markets and believe that there may be some form of consolidation or profit taking in March;
b) There are fewer stock catalysts going into March as most companies would have reported their results;
c) For the U.S. side, we will have more clarity on President Trump’s tax and health care reform and infrastructure spending. There may be some profit taking as high expectations have been priced into the market;
d) U.S. debt ceiling will come into debate next month when the latest suspension of the limit expires on March 15. Furthermore, there is a FOMC meeting on 16 March.
e) According to an article on Bloomberg, S&P500 index is trading at 3x P/BV, the highest since 2004;
f) S&P500 is eerily clam. Since 7 Dec 2016, S&P500 has not moved in either direction of 1% or more.
Readers who wish to be notified of my write-ups and / or informative emails, can consider signing up at http://ernest15percent.com. However, this reader’s mailing list has a one or two-day lag time as I will (naturally) send information (more information, more emails with more details) to my clients first. For readers who wish to enquire on being my client, they can consider to leave their contacts here http://ernest15percent.com/index.php/about-me/
Lastly, many new clients have asked me how I screen and decide which companies to take a closer look / write. To understand more about my basis of deciding which companies to write, you can download a copy of my eBook available on my website HERE.
P.S: Do note that as I am a full time remisier, I can change my equity allocation fast to capitalize on the markets’ movements.
Disclaimer
Please refer to the disclaimer HERE
Fantastic blog post. Awesome.
Thanks so much for the post.Much thanks again. Will read on…
Very neat article.Much thanks again. Want more.
Great article post.Really thank you! Great.
Im grateful for the blog post.Thanks Again. Great.
I appreciate you sharing this post.Really looking forward to read more. Want more.
Very good blog.Really looking forward to read more. Will read on…
Thanks a lot for the article post.Really looking forward to read more. Fantastic.
Fantastic article.Really thank you! Cool.
Appreciate you sharing, great article.Really looking forward to read more. Really Great.
Enjoyed every bit of your post.Much thanks again. Will read on…
Wow, great article.Really looking forward to read more. Really Great.
Really enjoyed this blog.Really thank you! Keep writing.
I truly appreciate this article.Really looking forward to read more. Awesome.
Very informative blog post.Really thank you!
Major thanks for the blog post. Will read on…
A big thank you for your article. Will read on…
I think this is a real great article post.Really looking forward to read more. Will read on…
A round of applause for your article post. Keep writing.
wow, awesome blog post. Will read on…
I am so grateful for your blog post.Thanks Again. Want more.
Major thankies for the blog.Really thank you! Awesome.
Thanks again for the post.Thanks Again. Want more.
Very good blog.Really looking forward to read more. Keep writing.
Really appreciate you sharing this article post.Much thanks again.
Very informative post.Really looking forward to read more. Really Great.
Very neat blog post.Thanks Again. Cool.
Looking forward to reading more. Great article.Thanks Again. Really Cool.
Awesome blog article.Much thanks again. Much obliged.
Thanks again for the blog article.Really thank you! Want more.
I loved your post.Thanks Again.
wow, awesome blog article.Thanks Again. Cool.
Im obliged for the blog post. Awesome.
Hey, thanks for the post. Want more.
Really enjoyed this post.Thanks Again. Fantastic.
Very informative blog.Much thanks again. Much obliged.
Thanks so much for the post.Thanks Again. Cool.
Really appreciate you sharing this article post.Really looking forward to read more. Much obliged.
I cannot thank you enough for the post.Thanks Again. Keep writing.
Thank you for your blog post.Really thank you!
A big thank you for your article. Cool.
Muchos Gracias for your post. Want more.
Im thankful for the post.Really thank you! Awesome.
Thanks-a-mundo for the article.Much thanks again. Keep writing.
Really appreciate you sharing this post. Much obliged.
Great, thanks for sharing this article post.Much thanks again. Keep writing.
Thank you ever so for you blog post.Thanks Again. Awesome.
Great, thanks for sharing this article.Really thank you! Cool.
Appreciate you sharing, great blog.Much thanks again. Keep writing.
I cannot thank you enough for the post.Really thank you!
I truly appreciate this post. Will read on…
I really liked your article.Thanks Again. Really Cool.
I really liked your blog.Much thanks again. Fantastic.
wow, awesome blog.Much thanks again. Cool.
I value the blog article.Much thanks again. Want more.
Great post. Keep writing.
Great article post.Really looking forward to read more. Much obliged.
This is one awesome blog article.Really looking forward to read more. Really Great.
I truly appreciate this blog post.Really thank you!
Major thankies for the post. Want more.
Thanks a lot for the blog.Really looking forward to read more. Want more.
A big thank you for your blog. Awesome.
I really liked your article.Really thank you! Really Great.
Im grateful for the article.Much thanks again. Great.
Thanks for the post.Really looking forward to read more. Fantastic.
I really liked your blog.Really thank you! Great.
Fantastic blog article.Really looking forward to read more. Really Cool.
This is one awesome blog post.Really looking forward to read more. Will read on…
I really enjoy the blog.Really thank you! Keep writing.
Very good article post.Thanks Again. Much obliged.
I truly appreciate this blog post.Really thank you! Cool.
Thanks so much for the article post.Really looking forward to read more. Really Cool.
I value the blog article.Really looking forward to read more. Fantastic.
I truly appreciate this article post.Really thank you! Really Great.
Thanks for the article.Really looking forward to read more. Want more.
Thanks-a-mundo for the blog post.Really looking forward to read more. Great.
A round of applause for your article post.Really looking forward to read more. Want more.
Muchos Gracias for your post. Much obliged.
Awesome article post. Keep writing.
Im thankful for the article post.Really thank you! Really Cool.
Thanks for the post.Much thanks again. Much obliged.
I loved your article post. Great.
Looking forward to reading more. Great article post. Much obliged.
Thanks for the article post.Thanks Again. Awesome.
I loved your blog. Awesome.
Thanks-a-mundo for the post.Really looking forward to read more. Awesome.
Enjoyed every bit of your blog post.Much thanks again. Much obliged.
wow, awesome article.Really looking forward to read more. Cool.
Thanks again for the post.Much thanks again. Cool.
I truly appreciate this article.Much thanks again. Keep writing.
Really informative blog post.Thanks Again. Fantastic.
wow, awesome blog post.Really thank you! Fantastic.
Very good blog article.Really looking forward to read more. Will read on…
I value the blog article. Want more.
wow, awesome blog.Much thanks again. Really Great.
I really like and appreciate your article post.Really looking forward to read more. Want more.
Great blog article.Really thank you! Really Great.
Appreciate you sharing, great blog article.Thanks Again. Awesome.
I cannot thank you enough for the blog post.Thanks Again.
Thank you ever so for you article.Thanks Again. Keep writing.
I loved your article.Really thank you! Keep writing.
Very informative post.Really thank you! Keep writing.
Im obliged for the blog.Really looking forward to read more. Really Great.
Im thankful for the article post.Really looking forward to read more. Cool.
Thanks so much for the blog article.Really looking forward to read more.
I am so grateful for your blog article. Awesome.
Hey, thanks for the blog.Really looking forward to read more. Want more.
Im grateful for the article post.Thanks Again. Want more.
Thank you ever so for you article.Thanks Again.
Thanks so much for the blog post.Really looking forward to read more. Awesome.
Major thanks for the post.Thanks Again. Will read on…
Looking forward to reading more. Great blog post.Really thank you! Want more.
Thanks a lot for the blog.Really looking forward to read more. Really Great.
Say, you got a nice article.Thanks Again. Will read on…
Say, you got a nice article.Much thanks again. Awesome.
Very informative blog.Really looking forward to read more. Really Great.
Major thankies for the article post.Much thanks again.
Thanks so much for the blog. Really Cool.
Major thankies for the article.Really looking forward to read more. Cool.
I loved your blog.Really looking forward to read more. Cool.
Muchos Gracias for your blog post.Much thanks again. Awesome.
Very good post. Will read on…
Thank you ever so for you blog article. Will read on…
Thanks again for the blog. Great.
Thanks again for the post.Thanks Again. Much obliged.
Thanks again for the article post. Fantastic.
Great blog post.Thanks Again.
Really appreciate you sharing this blog.Really thank you! Keep writing.
Very good article post.
Thanks for the blog.Much thanks again. Keep writing.
Im thankful for the blog post.Really thank you! Much obliged.
I cannot thank you enough for the post.Really thank you! Awesome.
Wow, great article post.Really thank you! Much obliged.
Thank you for your blog article.Much thanks again. Great.
Thanks so much for the article. Really Cool.
Im grateful for the blog.Much thanks again. Fantastic.
I loved your blog post. Really Great.
I truly appreciate this article. Much obliged.
Great post.Much thanks again. Fantastic.
Really informative blog.Thanks Again. Really Cool.
Great post. Much obliged.
Very informative blog article.Really looking forward to read more. Awesome.
Wow, great blog article.Really looking forward to read more. Great.
wow, awesome post.Really looking forward to read more. Really Great.
I loved your blog article.Really thank you!
Very good blog. Want more.
I am so grateful for your article. Cool.
Thank you ever so for you article post.Really looking forward to read more. Really Cool.
Very neat article.Really looking forward to read more. Cool.
Thanks for the blog post.Thanks Again. Will read on…
Really appreciate you sharing this article post.Really thank you! Will read on…
Very neat post.Thanks Again. Awesome.
Awesome article post.Much thanks again. Cool.
wow, awesome blog article.Really looking forward to read more. Cool.
A big thank you for your post.Really thank you! Much obliged.
Thanks a lot for the article.Thanks Again. Great.
wow, awesome blog article. Will read on…
Thanks for sharing, this is a fantastic blog. Great.
Wow, great blog post.Really looking forward to read more. Really Great.
Thanks for sharing, this is a fantastic article post.Really thank you! Much obliged.
Say, you got a nice blog.Really looking forward to read more. Really Great.
Fantastic post.Thanks Again. Keep writing.
Thanks-a-mundo for the blog post.Really looking forward to read more. Want more.
I value the article.Really looking forward to read more. Cool.
I cannot thank you enough for the blog post.Really looking forward to read more. Will read on…
Thanks for the article post.Thanks Again. Keep writing.
Really appreciate you sharing this blog article.Really thank you! Really Cool.
Thanks so much for the article post.Really thank you! Fantastic.
Really informative article.Much thanks again. Awesome.
Great, thanks for sharing this blog.Really thank you! Fantastic.
Enjoyed every bit of your article post.Much thanks again. Much obliged.
Say, you got a nice blog post.Much thanks again. Really Great.
Really informative blog post.Much thanks again. Really Great.
I really like and appreciate your blog article.Much thanks again. Cool.
Im grateful for the article.Really looking forward to read more. Cool.
Thanks a lot for the article post.Thanks Again. Awesome.
Major thanks for the blog post.Thanks Again. Want more.
I am so grateful for your post.Thanks Again. Cool.
Very neat post.Really looking forward to read more. Cool.
I value the blog article.Really looking forward to read more. Great.
Looking forward to reading more. Great article.Thanks Again. Will read on…
Great, thanks for sharing this article.Thanks Again. Awesome.
Thanks-a-mundo for the blog. Cool.
Thanks for sharing, this is a fantastic article. Fantastic.
Looking forward to reading more. Great blog article.Thanks Again. Really Cool.
Very neat post.Much thanks again. Really Cool.
I appreciate you sharing this blog article.Much thanks again. Really Great.
I cannot thank you enough for the post.Much thanks again. Keep writing.
I really enjoy the article post.Really thank you! Will read on…
Say, you got a nice blog post. Fantastic.
Very good article post.Really thank you! Really Cool.
Fantastic article post.Much thanks again. Cool.
Thank you ever so for you article.Much thanks again. Keep writing.
I really enjoy the blog article.Really looking forward to read more. Great.
Great article.Really looking forward to read more. Really Cool.
Muchos Gracias for your blog post.Really thank you! Much obliged.
Great, thanks for sharing this blog. Great.
Awesome blog post.Thanks Again. Great.
Really enjoyed this blog article.Thanks Again. Great.
I really enjoy the blog. Fantastic.
Thanks a lot for the blog article.Really thank you! Will read on…
Very neat blog post.Really thank you! Great.
Hey, thanks for the blog article.Really thank you! Cool.
Im thankful for the article.Really thank you! Will read on…
Appreciate you sharing, great post.Thanks Again.
I cannot thank you enough for the blog.Thanks Again. Want more.
Muchos Gracias for your article.Thanks Again. Keep writing.
I think this is a real great article.Really looking forward to read more. Will read on…
Major thankies for the blog article.Much thanks again. Really Cool.
I couldn’t resist commenting. Well written.
Fantastic article post.Much thanks again.
Really informative post.Really thank you! Great.
Thank you ever so for you post. Great.
Very good blog article. Really Cool.
Say, you got a nice blog.Really thank you! Fantastic.
Really informative blog article. Keep writing.
Very good post. Really Cool.
Looking forward to reading more. Great blog. Cool.
Very nice post. I certainly love this website. Continue the good work!
Thanks for sharing, this is a fantastic blog post. Want more.
I cannot thank you enough for the article post.Really looking forward to read more. Really Great.
Thank you ever so for you blog.Really thank you!
Muchos Gracias for your article post.Thanks Again. Want more.
Say, you got a nice article.Thanks Again. Keep writing.
I am so grateful for your blog post.Thanks Again. Really Great.
Im grateful for the blog article.Really looking forward to read more. Want more.
Wow, great article.Much thanks again. Will read on…
Im grateful for the blog article.Thanks Again. Cool.
Im grateful for the blog article.Really thank you!
Thanks a lot for the post.Thanks Again. Keep writing.
I really like and appreciate your article.Much thanks again. Keep writing.
Very neat post.Thanks Again. Fantastic.
Wow, great blog post.Thanks Again. Great.
Thanks-a-mundo for the post. Really Great.
wow, awesome blog. Cool.
I appreciate you sharing this post.Really looking forward to read more. Really Cool.
You have noted very interesting details! ps decent web site.Blog money
Really informative blog post.Thanks Again. Much obliged.
Hey, thanks for the blog article.Really looking forward to read more. Will read on…
Thanks for sharing, this is a fantastic blog. Cool.
Wow, great article. Keep writing.
Very neat blog article.Really looking forward to read more. Much obliged.
https://artdaily.com/news/171650/Mp3Juice-Review–The-Pros-and-Cons-You-Need-to-Know
Great article. Cool.
I think this is a real great article post.Much thanks again. Really Great.
Muchos Gracias for your blog post.Thanks Again. Cool.
Really informative article. Really Cool.
This blog was… how do you say it? Relevant!! Finally I have found something which helped me. Many thanks!
Great, thanks for sharing this blog.Really thank you! Awesome.
Fantastic blog post.Really thank you!
I love it whenever people come together and share thoughts. Great website, stick with it.
Very neat article post.Really looking forward to read more. Great.
Very good article post.Much thanks again. Cool.
Having read this I believed it was extremely informative. I appreciate you taking the time and energy to put this information together. I once again find myself spending a significant amount of time both reading and posting comments. But so what, it was still worthwhile!
Thanks for sharing, this is a fantastic post. Much obliged.
Very good post.Really looking forward to read more. Really Cool.
This is one awesome article.Really looking forward to read more. Awesome.
I am so grateful for your blog article.Thanks Again. Really Cool.
Hey, thanks for the article post. Really Great.
Very neat post.Much thanks again. Will read on…
This is a topic that is near to my heart… Take care! Exactly where are your contact details though?
Major thanks for the blog post.Much thanks again. Really Cool.
Thanks so much for the article post.Really looking forward to read more. Awesome.
Very neat blog.Really thank you! Cool.
Thanks a lot for the blog.Really looking forward to read more. Great.
Thank you ever so for you article post.Thanks Again. Really Great.
Very good blog.Really looking forward to read more. Cool.
Say, you got a nice article.Really thank you! Will read on…
Oh my goodness! Amazing article dude! Many thanks, However I am having issues with your RSS. I don’t understand why I can’t join it. Is there anybody else having the same RSS issues? Anybody who knows the answer will you kindly respond? Thanks!!
Great, thanks for sharing this article post.Much thanks again. Fantastic.
Major thankies for the blog article.Much thanks again.
Great blog. Great.
A big thank you for your blog.Really thank you! Awesome.
Fantastic article post. Much obliged.
Really enjoyed this post.Really looking forward to read more. Awesome.
Thanks for sharing, this is a fantastic blog.Really thank you! Great.
Way cool! Some extremely valid points! I appreciate you penning this post and also the rest of the website is also really good.