Dear all,
Happy Chinese New Year 元宵节!
The animal spirits seem to have descended on our Singapore market! Our STI is one of the best performing indices with a blistering 7.6% year to date return. Our FSTS ST Small Cap Index has returned 4.6% for the same period. Have you benefitted from this rally?
What’s next for our markets?
S&P500
Just to recap what I have mentioned on 27 Jan 2017 (see HERE), I wrote “it is very worrying (more worrying than 13 Jan) that the various indicators such as RSI, MACD, OBV and MFI continue to exhibit bearish divergences. ADX has slid from 41 in Dec 2016 to close at around 20 on 27 Jan 2017, which may indicate that the trend seems to be weakening. Given the various chart indications, although S&P500 continues to be on an uptrend amid rising exponential moving averages (“EMAs”), I reiterate that S&P500 may have limited potential upside with resistance 2,300 – 2,325. It is unlikely to make a sustained close above 2,325 in the near term.”
–> S&P500 touched an intraday high of 2,319 (one point above my mentioned resistance of 2,318) before closing at 2,316 on 10 Feb 2017.
Based on Chart 1 below, various indicators such as RSI, MACD, OBV and MFI continue to exhibit bearish divergences. ADX has slid from 41 in Dec 2016 to close at around 18 on 10 Feb 2017, which is indicative of a trendless market. RSI closed at 70 on 10 Feb 2017. Given the various chart indications, although S&P500 continues to be on an uptrend amid rising exponential moving averages (“EMAs”), I reiterate that S&P500 may have limited potential upside with resistance 2,300 – 2,325. It is unlikely to make a sustained close above 2,325 in the near term.
Near term supports: 2,295 – 2,300 / 2,288 / 2,273 – 2,278
Near term resistances: 2,318 / 2,325 / 2,350
Chart 1: S&P500 – limited potential upside around 2,300 – 2,325
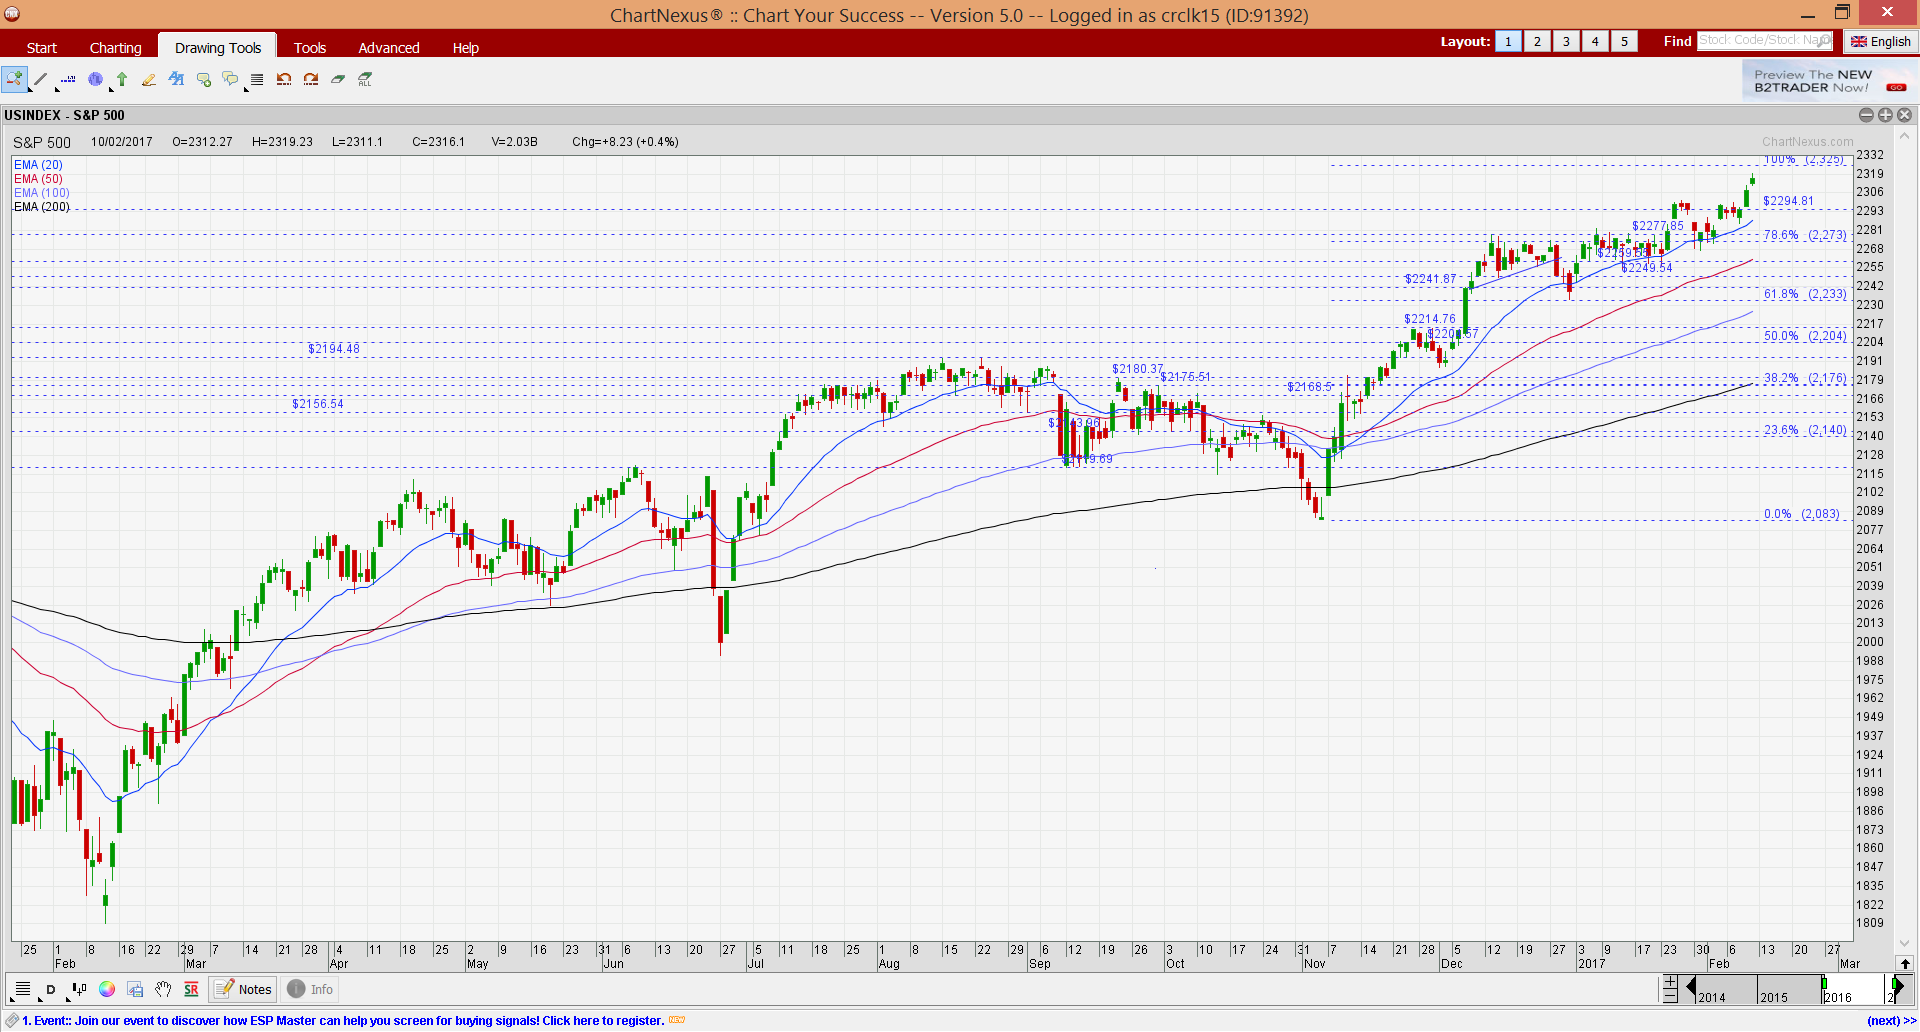
Source: Chartnexus chart as of 10 Feb 2017
Hang Seng Index
Based on my write-up on 27 Jan 2017, I mentioned that “Hang Seng’s chart looks more promising than S&P500. The EMAs are rising with 20D EMA forming golden crosses with 50D, 100D and 200D EMA. Amid positively placed directional indicators (“DI”), ADX has risen from 22 on 6 Jan 2017 to close at 24 on 27 Jan 2017, indicative of a trend. Most of the indicators such as RSI, OBV and MACD have not exhibited bearish divergences.”
–> Hang Seng continues to be bullish and rose 214 points or 0.9% from 23,374 on 27 Jan 2017 to close at 23,575 (near my previously mentioned resistance of around 23,560) on 10 Feb 2017.
Based on Chart 2 below, Hang Seng’s chart continues to look more promising than S&P500. This is due in part to the absence of bearish divergences from the indicators such as RSI, MACD, OBV etc. Furthermore, amid positive placed DIs, ADX has risen from 24 on 27 Jan 2017 to close 28 on 10 Feb 2017. Hang Seng’s EMAs continue to rise with 20D EMA forming golden crosses with 50D, 100D and 200D EMA. RSI closed at around 70 on 10 Feb 2017. Except for one period around Sep 2016 where RSI hit 80, it does not usually exceed the low 70s since May 2015.
Near term supports: 23,150 – 23,200 / 22,845 – 22870 / 22,680 – 22,700
Near term resistances: 23,680 / 23,930 / 24,100
Chart 2: Hang Seng looks more promising than S&P500 but is getting overbought
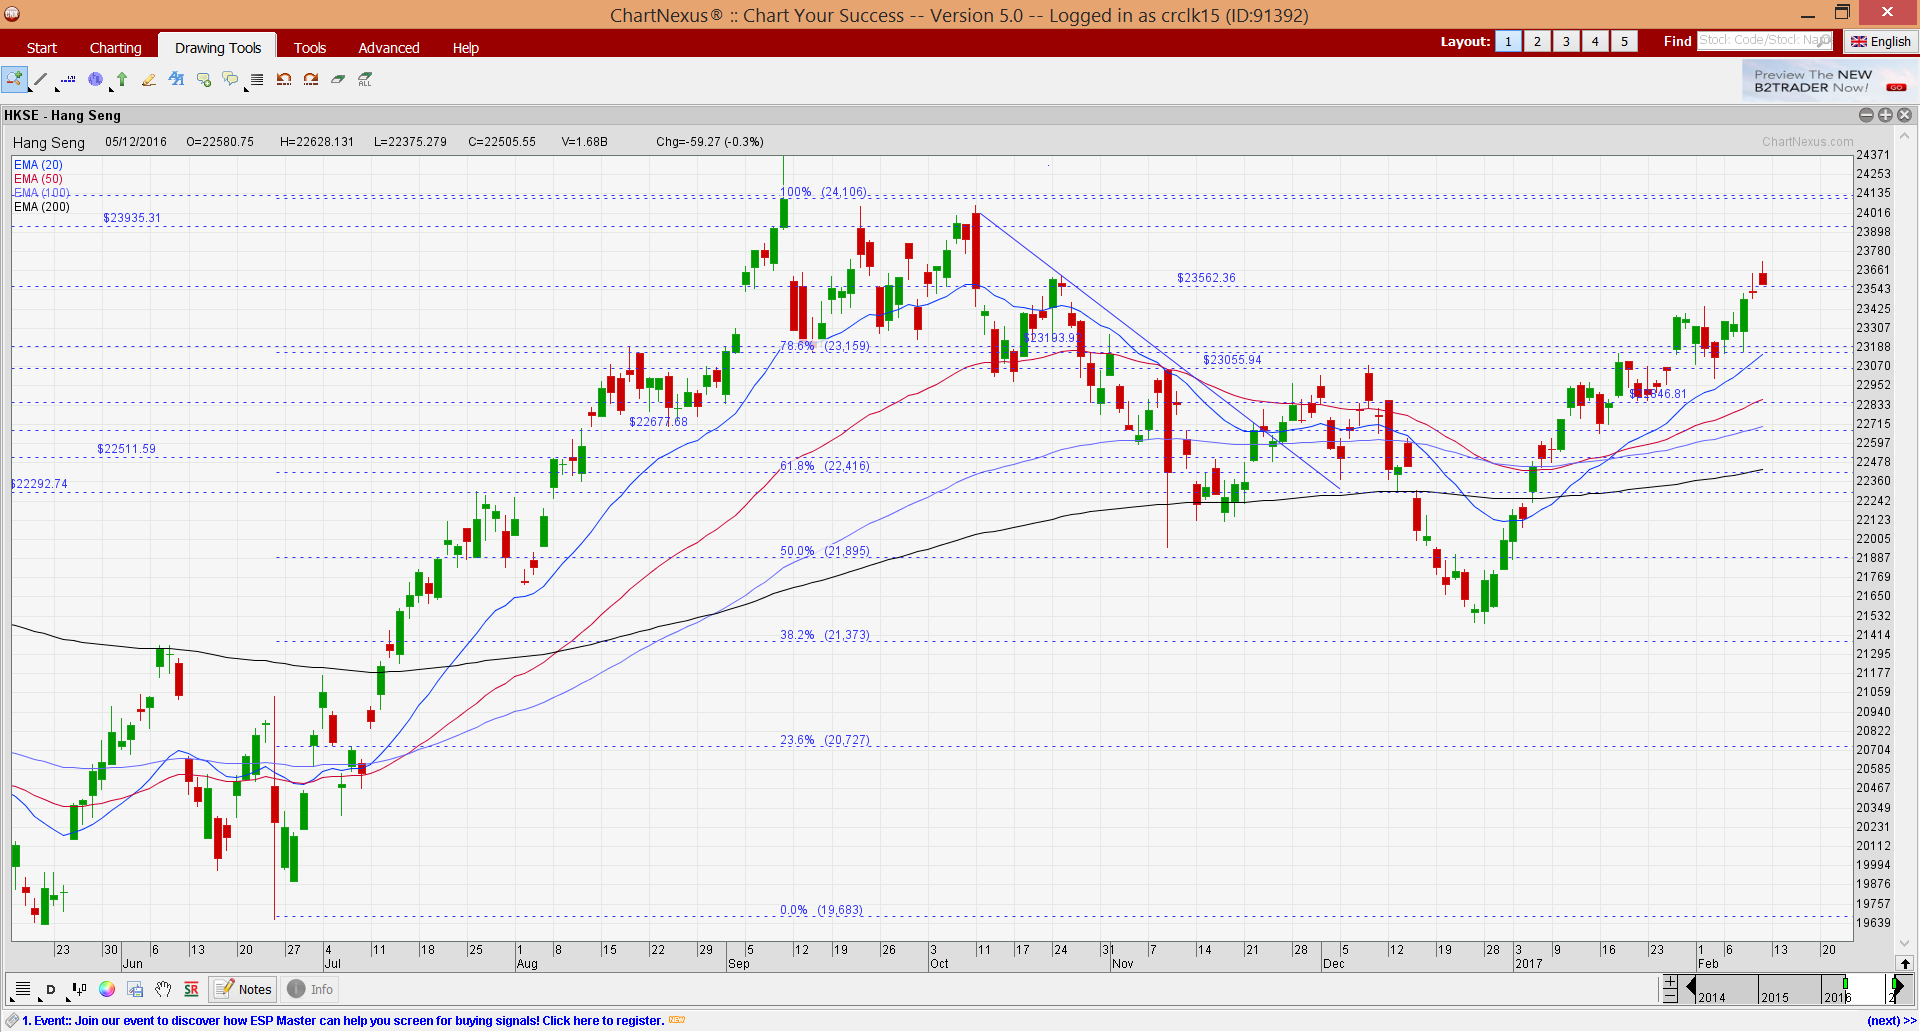
Source: Chartnexus chart as of 10 Feb 2017
STI
On 27 Jan 2017, I wrote “my personal view is that STI’s chart seems to have limited potential upside. Coupled with the points (such as STI hitting my eventual measured target; dragonfly doji; bearish divergences from indicators), STI’s risk – reward is not favourable for long positions. Furthermore, my view is that it is likely to be most prone to profit taking vis-à-vis S&P500 and Hang Seng.”
–> STI rose 1.2% for the past two weeks and closed at 3,100. It has exceeded my target of 3,064 (I previously mentioned it is unlikely to make a sustained close above 3,064) by around 1%. STI closed at 3,100 on 10 Feb 2017.
Based on Chart 3 below, I reiterate my cautious stance on STI’s chart due to
a) STI has risen 242 points, or 8.5% from 2,858 on 27 Dec 2016 to close 3,100 on 10 Feb 2017. The rally has been fast without any meaningful profit taking. RSI closed at 72 on 10 Feb 2017;
b) Indicators such as MACD, RSI exhibit bearish divergences. As previously mentioned, bearish divergences are not outright sell signals but they indicate “caution” to me;”
c) There seems to be rotation to the small cap, especially the penny counters. For example, Serrano surged 3,900% from $0.002 on 31 Jan 2017 to an intraday high of $0.080 on 8 Feb 2017. FSTS ST Small Cap Index has outperformed the STI by returning 2.0% for the past two weeks, vis-à-vis 1.2% for STI. Typically, when such penny stocks start to rally to such magnitude, it seems to be indicative of (at least) some froth in the market.
All in, my personal view is that STI’s risk – reward is generally not favourable for long positions. Readers who are extremely nimble may be able to get a few bids of profit here and there. However, they have to be fast to exit long speculative positions, should the tide turn.
Near term supports: 3,080 / 3,068 / 3,064
Near term resistances: 3,118 / 3,148 / 3,173
Chart 3: STI – reiterate risk reward not favourable for long positions, except for the nimble
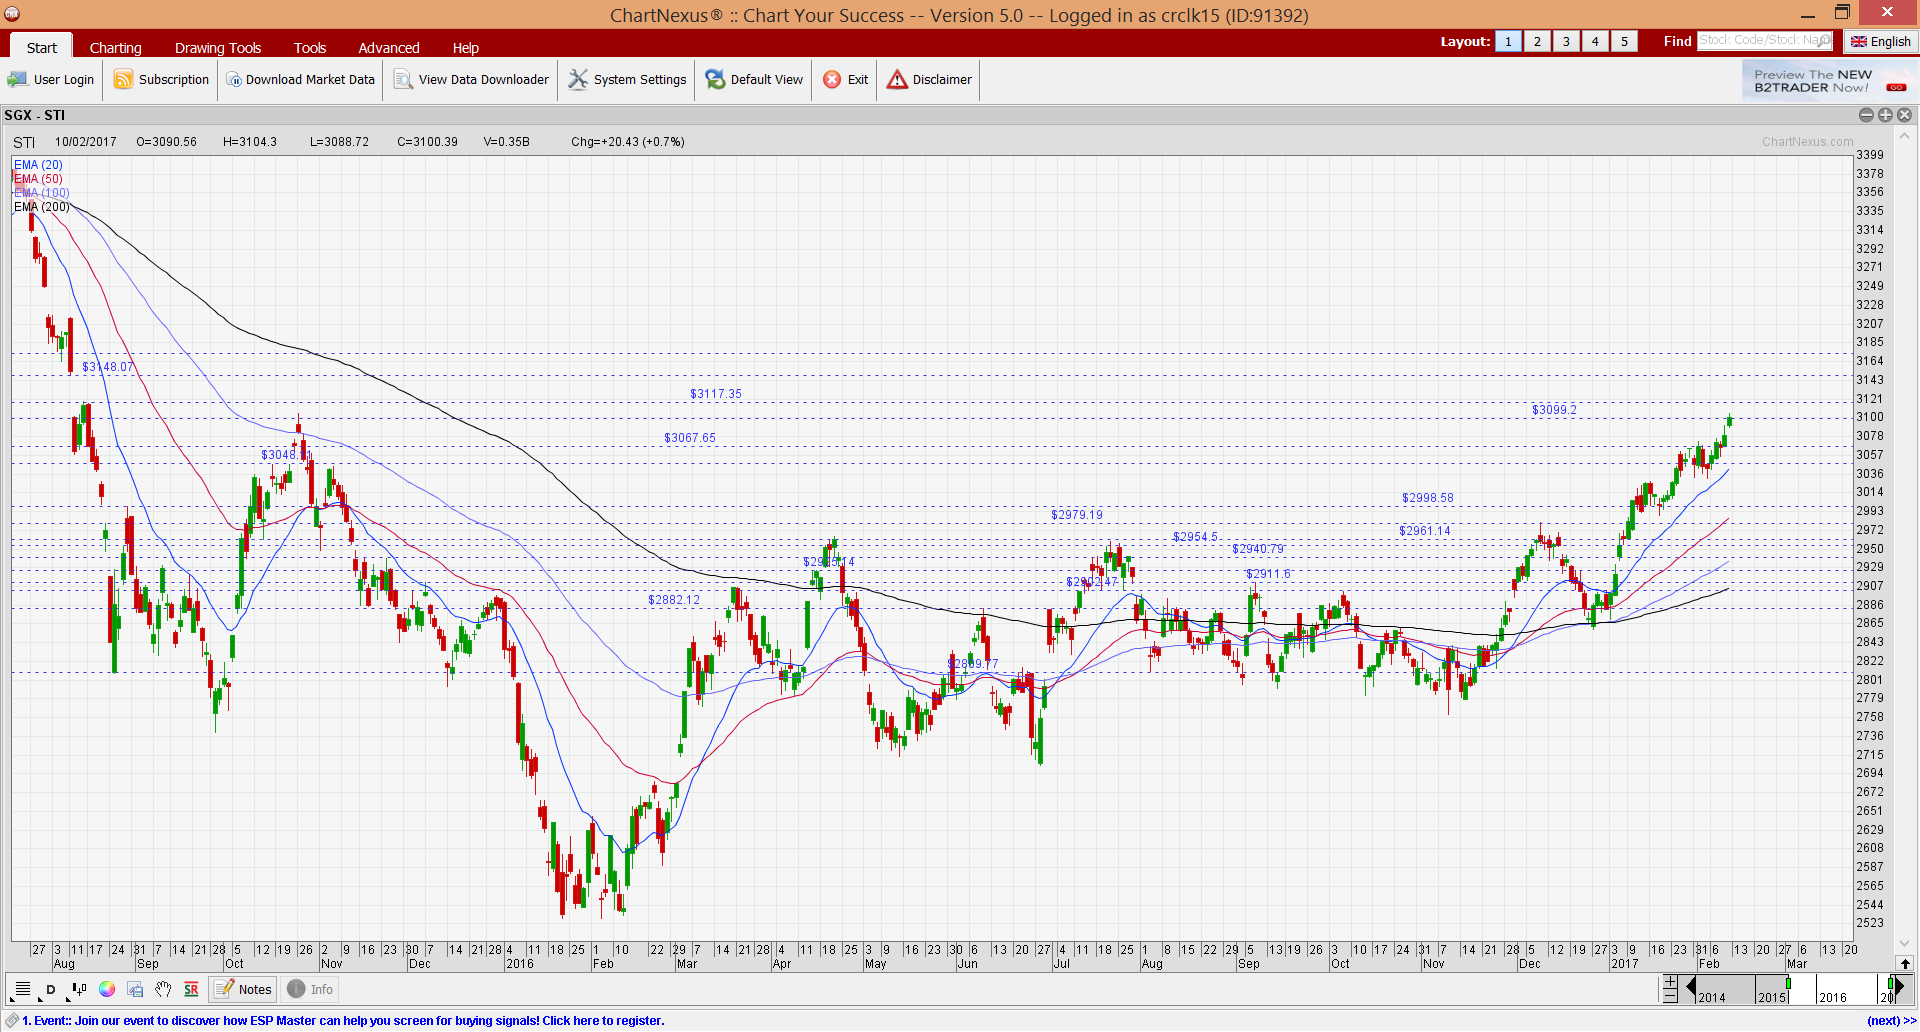
Source: Chartnexus chart as of 10 Feb 2017
Conclusion – cautious on general market but ready to buy selective stocks on weakness
Since 27 Jan 2017, I have taken profit on some stocks, initiated long and short positions on certain stocks. Overall, my net percentage invested was approximately unchanged, just below 50%.
As previously indicated, I am cautious on the general market, especially those stocks which have reached overbought levels. However, as the recent market trend is “stock rotation”, I have pinpointed some interesting charts, namely Midas, Sapphire, Sunpower, Terratech on 9 Feb 2017 which catch my attention. Below is a summary of my observations based on 9 Feb 2017 information.
Midas – (bullish) inverse head and shoulder pattern seems to be confirmed.
Sapphire – on the verge of a bullish breakout beyond its trading range $0.285 – 0.325.
Sunpower – highly overbought amid all time high price.
Terratech – seems to have broken out on 9 Feb 2017 with volume expansion.
Please click HERE to read more.
As I feel that the market is pretty high with a certain level of froth, although I may do some short-term trading, I remain ready to exit my long positions quickly, if necessary. (My clients have, will & are informed on new stocks which I have entered and upon any significant portfolio change.)
Hereby, wishing all readers a blessed and prosperous Rooster Year ahead!
Readers who wish to be notified of my write-ups and / or informative emails, can consider signing up at http://ernest15percent.com. However, this reader’s mailing list has a one or two-day lag time as I will (naturally) send information (more information, more emails with more details) to my clients first. For readers who wish to enquire on being my client, they can consider to leave their contacts here http://ernest15percent.com/index.php/about-me/
Lastly, many new clients have asked me how I screen and decide which companies to take a closer look / write. To understand more about my basis of deciding which companies to write, you can download a copy of my eBook available on my website HERE.
P.S: Do note that as I am a full time remisier, I can change my equity allocation fast to capitalize on the markets’ movements.
Disclaimer
Please refer to the disclaimer HERE
Wow, incredible blog structure! How lengthy have you been blogging for?
you make running a blog glance easy. The entire glance of
your web site is excellent, let alone the content!
You can see similar here dobry sklep
Very superb information can be found on site.Blog money