Dear all,
U.S. equity markets have logged their worst weekly performance in the past six months. For our local market, STI has dropped 16.7% from an intra-day high of 3,642 on 2 May 2018 to an intra-day low of 3,035 on 11 Oct 2018. It closed at 3,069 on 12 Oct 2018.
Is a bear market coming? There are mixed views.
Bears are saying that we have not reached the bottom yet. Some perma-bears are even saying this may be the start of the bear market. Bulls are saying that this represents a window of opportunity to accumulate stocks on weakness and that the bull market is not over yet.
My personal view is that this is unlikely to be the start of the bear market. Since last month, I have already informed clients to trim their portfolios. In fact, on 26 Sep, I have sent out another email to reiterate my cautious stance in the next couple of weeks, and that I have trimmed my percentage invested to 15%. I have since taken the market sell off to add to those stocks which I like, albeit at lower prices than before with a horizon of 1-3 months.
See my basis below and my portfolio strategy.
Basis of buying in this market sell-off
U.S. 3Q corporate earnings still expect to post >20% y/y growth
According to I/B/E/S estimates from Refinitiv, U.S. 3Q corporate earnings are still expected to post 21.5% year on year growth. According to an article in MarketWatch, FY19F earnings are likely to increase approximately 9.9% as compared to FY18F. Based on current estimates, corporate results continue to be a pillar of strength for the stock market.
Inflow of funds in ETF
Based on Factset, notwithstanding the market sell-off, approximately US$5.4b has flowed into U.S.-listed stock ETFs this week. This is in stark contrast to the sell-off which we have experienced in 1Q2018 (more in Feb and Mar) where there is an exodus of funds. Thus, there is still healthy demand for equities.
Inflation remains on check amid strong economy
According to U.S. Federal Reserve Chairman Jerome Powell, he mentioned on 2 Oct 2018 that notwithstanding the strong U.S. economy, low unemployment, rising wages, global trade tariffs, inflation still remains around their target 2% range. He also emphasised that he is cognisant that there is a possibility that inflation may surge hence he has been gradually raising interest rates. Thus, it seems inflation remains on check for now. Furthermore, an environment with good economic growth, low unemployment and comfortable inflation seems to be a conducive one for stocks.
Seasonal / Calendar effect: October typically a volatile month, but not a bad month
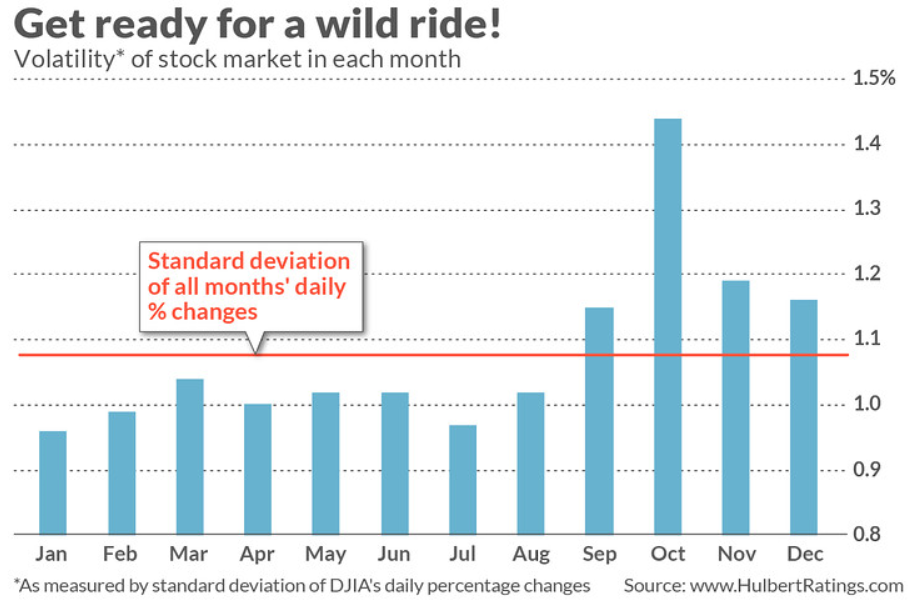
According to Mark Hulbert, Founder of Hulbert Financial Digest and senior columnist for MarketWatch, he cited data (See Chart 1 below) that October is the most volatile month as measured by standard deviation. He added that even excluding the outliers such as the Oct 1987 crash and Oct 2008, October’s standard deviation is still higher than the other months. Nevertheless, in the same article dated 25 Sep 2018 (see HERE), he pointed out that this does not mean that Oct is a weak month in terms of stock performance. In fact, October ranked 8th in terms of stock market performance.
Citing data from Ned Davis Research, it is noteworthy that firstly, eight out of 35 bull markets started in October. Secondly, in terms of bear markets, only one out of 35 bear markets commenced in October.
Chart 1: Standard deviation of all months’ daily % changes
In addition, based on DBS Research, they mentioned some statistics compiled since 2001 which corroborated October is seasonally a good month for equities.
a) The 1st month of each quarter has registered positive month on month gains (>=75% reliability);
b) There has been five out of seven times that October is a positive month when August and September are both down months;
c) Since 2001, 4Q has registered positive quarter on quarter gains 12 out of 17 times;
Valuations are not excessive
According to CFRA Research, U.S. stocks do not seem expensive as they are trading at around 17x forward earnings which are only approximately 5% higher than the average PE of the last 18 years.
For our local market, valuations seem reasonable too. With reference to Figure 1 below, 5 Year average PE and P/BV are around 12.8x and 1.2x respectively. Current PE and P/BV are at 10.9x and 1.1x respectively. There has been a handful of corporate actions such as the offers / privatisations for Wheelock Properties; M1 and Keppel T&T. These seem to indicate that there is value in our local market. Furthermore, our Singapore market is supported with reasonable dividend yields of around 4.2% and a stable SGD currency.
Figure 1: STI’s 5-year PE & P/BV metric band

Source: Bloomberg 12 Oct 18
Of course, there are risks. Examples are…
Forward guidance is key
Market is usually forward pricing. Thus, forward guidance by companies is key. Amid the spectre of higher interest rates, global trade tensions, stronger U.S. dollar, rising oil prices, much attention will be focused on the forward guidance given by company management. It is noteworthy that the strong earnings growth in 2018 is boosted partially by tax deduction.
Multiple risks abound – but most of which are not new
There is a multitude of risks quoted by the media and market experts with the recent market sell-off, such as surging bond yields; expectations that Fed may raise interest rates faster, or slower than optimal; slashing of global economic growth by IMF; rising global (particularly U.S-China) trade tensions; runaway inflation; surging oil prices; strength in U.S Dollar; weakness in emerging markets; high valuations in U.S. markets (depending on which valuations are cited); peak in U.S. earnings etc.
Yes, there are certainly many risks but many of such risks are not new risks, and I have earlier communicated such risks to my clients, hence my underweight equity positions on 26 Sep. For example, U.S 10-year yields jumped 10.3 basis points to 3.16% on 3 Oct 2018, their largest one-day surge since 1 Mar 2018, and the highest since July 2011. However, S&P500 closed marginally higher on that day. Personally, I believe the market has the capacity to absorb most of these risks, barring a full fledge global tensions (particularly U.S – China trade tensions) and surging bond yields above 3.5%.
Some experts are saying “don’t jump into the market yet”
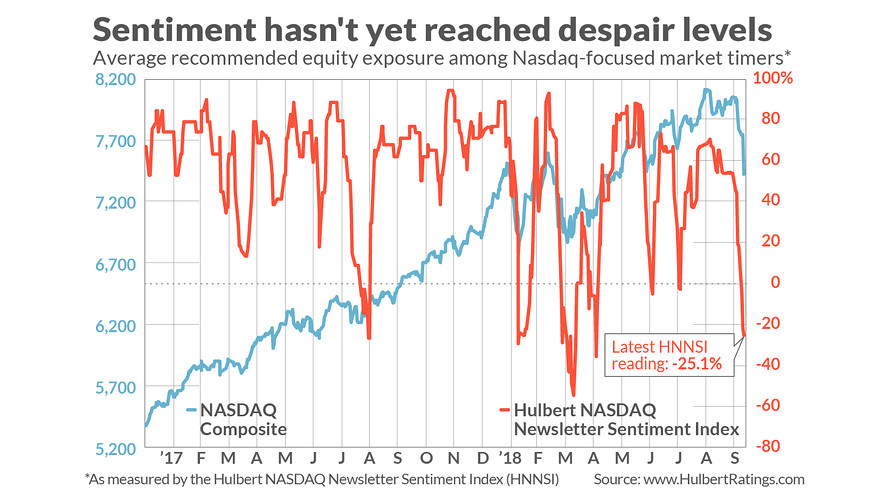
Based on an article by Mark Hulbert published on MarketWatch dated 11 Oct 2018 (click HERE), Mark used his Hulbert Nasdaq Newsletter Sentiment Index (see Chart 2 below), and he said that the sentiment is not excessively bearish for contrarians to enter the market (see the low seen in Mar 2018).
Chart 2: Sentiment has not reached the low last seen in Mar 2018
S&P500 tests its 200D EMA
Based on Chart 3 below, S&P500 has broken the short-term uptrend line established since Jun 2018. Except for 200D exponential moving averages (“EMA”), all the other exponential moving averages are trending lower. 20D EMA is on the verge of forming a death cross with 50D EMA. ADX has risen to 23.5 amid sharply negative placed directional indicators (“DIs”). RSI touched an oversold low of 17.7 on 11 Oct 2018 before closing at 29.5 on 12 Oct 18. Chart seems bearish as the uptrend is broken. A savings grace is that it has closed above its 200D EMA (currently around 2,759) on 12 Oct 2018. However, it takes time to assess whether S&P500 can hold above 200D EMA. A sustained break below its 200D EMA (currently around 2,759) adds to the bearishness of the chart.
Near term supports: 2,759 (200D EMA) / 2,728 / 2,710 / 2,698
Near term resistances: 2,788 / 2,795 / 2,817 / 2,827 (100D EMA)
Chart 3: A sustained break below its 200D EMA is pretty bearish
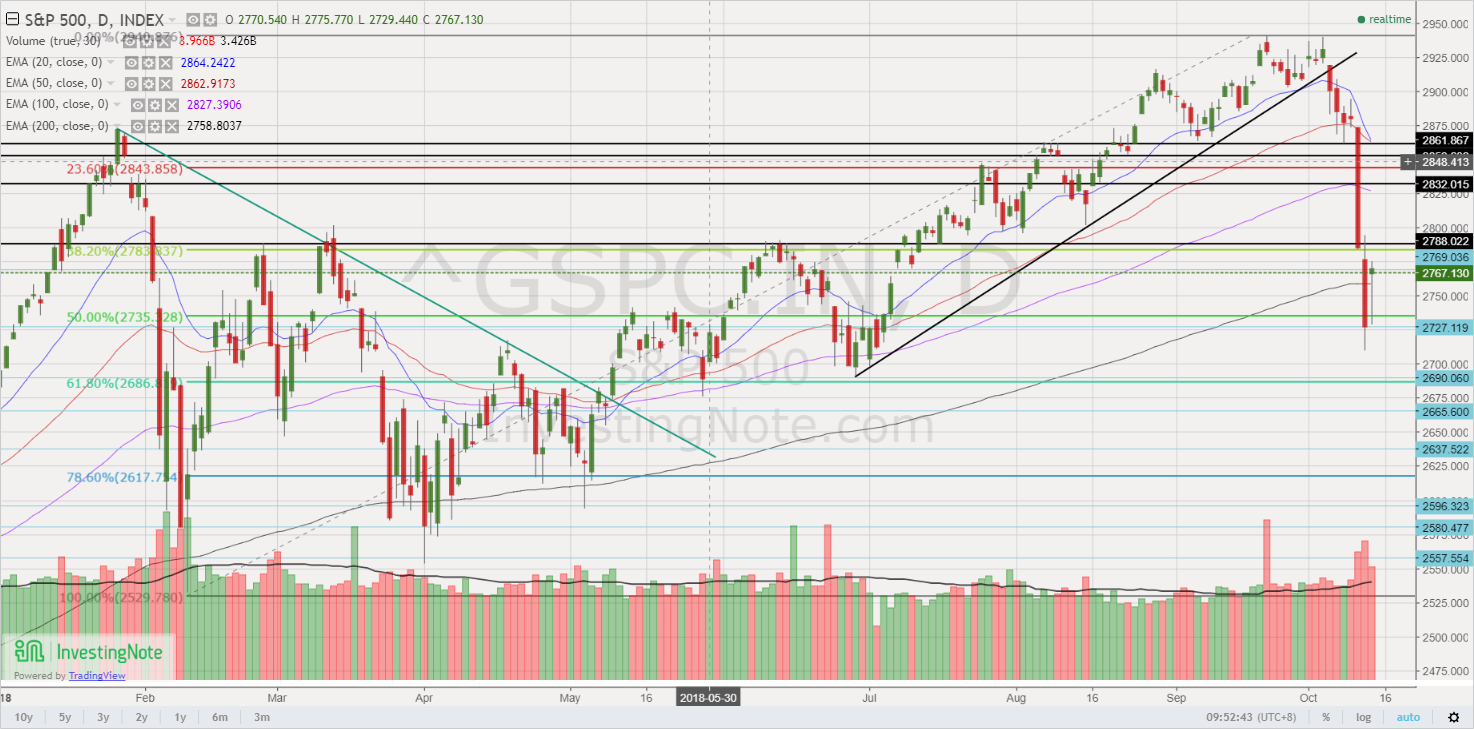
Source: InvestingNote 12 Oct 18
Unable to see longer than 3 months
Personally, as my clients know me, I seldom have a long-term view on the stock market. (I may have a long-term view on certain industries’ developments, such as China’s environmental push to reduce pollution; Singapore’s Smart Nation initiatives, but not on stock prices over the long term). This is because the stock market can be influenced by numerous factors, coupled with different participants in the market. I am aware of my personal limitations; thus, I tailor my trading / investing strategies accordingly with a horizon of 1-3 months.
Conclusion
Since last month, I have already informed clients to trim their portfolios. In fact, on 26 Sep, I have sent out another email to reiterate my cautious stance in the next couple of weeks, and that I have trimmed my percentage invested to 15%. Hang Seng and STI have slumped 2,016 pts and 170 points respectively since 26 Sep 2018.
As mentioned to some clients, I have been positioning for this volatility since 26 Sep and thus am ready to buy aggressively on weakness. For the past two days, I have increased my percentage invested from 15% to 220% with the help of leverage and have accumulated a handful of blue chips in Singapore and Hong Kong markets and some selected small mid-caps in Singapore. (I have informed my clients my holdings and stocks which I have high conviction). My personal view is that they should move higher from their depressed prices amid this sell-off. It remains to be seen whether I will be right in the next couple of months. If Dow or STI drops another 10%, then I may register meaningful losses. This is a judgement call and risk that I am willing to take. It is noteworthy that a sharp V shape recovery in share price is not my base case scenario, but I do think that stocks are likely to move higher nearer to 3Q results in late Oct to mid Nov.
As some of my private banking clients have enquired for a list of interesting stocks to take a look, I have compiled a list of stocks based on Bloomberg’s data as of 12 Oct 2018. Table 1 shows only the top five stocks with the highest estimated total potential return.
Table 1: List of top 5 stocks with the highest estimated total potential return

Source: Bloomberg as of 12 Oct 2018
Noteworthy points on Table 1 above
1.This compilation is based on Bloomberg’s data sorted with my set of criteria namely,
a) Estimated dividend yield for the next 12 months >=0%;
b) Market cap >= S$500m;
c) Presence of analyst target price i.e. covered by analysts
2. The above data is sourced from Bloomberg i.e. I have not checked the above data for accuracy etc.
3. Even though I put “ave analyst target price”, some stocks may only be covered by one analyst hence may be subject to sharp changes. Also, analysts may suddenly drop coverage. In addition, analyst target prices and estimated dividend yield may be subject to change anytime, especially after results announcement or after significant news announcements;
4. Table 1 above is for reference and only shows the top 5 stocks with the highest estimated total potential return. Do note that these 5 stocks have smaller market capitalisation, and some are illiquid. Such stocks may arguably have a higher potential risk component vis-à-vis the likes of DBS and Singtel. Therefore, readers should exercise their independent judgement and take into account of their percentage invested, returns expectation, risk profile, specific company developments and current market developments. It is best to research extensively before you make any investment decisions.
5. The entire list comprises of 103 stocks which I will send to my clients.
Meanwhile, have a great weekend ahead and hope the markets will be better heading towards 3Q results!
Important caveat
Naturally, my market outlook and trading plan are subject to change as charts develop. My plan will likely not be suitable to most people as everybody is different. As I am rather heavily invested ( I can still raise since I’m using CFD, but I prefer not to, unless there are opportunistic plays), I may trim my positions or switch my positions if I see any opportunities. Do note that as I am a full time remisier, I can change my trading plan fast to capitalize on the markets’ movements. Furthermore, I wish to emphasise that I do not know whether markets will definitely rebound, or continue to drop. However, I am acting according to my plans. In other words, my market outlook; portfolio management; actual actions are in-line with one other. Notwithstanding this, everybody is different hence readers / clients should exercise their independent judgement and carefully consider their percentage invested, returns expectation, risk profile, current market developments, personal market outlook etc. and make their own independent decisions.
Readers who wish to be notified of my write-ups and / or informative emails, can consider signing up at http://ernest15percent.com. However, this reader’s mailing list has a one or two-day lag time as I will (naturally) send information (more information, more emails with more details) to my clients first. For readers who wish to enquire on being my client, they can consider leaving their contacts here http://ernest15percent.com/index.php/about-me/
Disclaimer
Please refer to the disclaimer HERE
Hi there ,really? I use your web content for my blog danke
whoah this blog is wonderful i like reading your articles.
Stay up the good work! You recognize, many individuals are looking round for this
information, you could help them greatly.