Dear all
With reference to my writeup published on 30 Jan 2023 (click HERE), where I mentioned I would be cautious in the overall markets, especially after a sharp run up, US stocks have dropped consecutively for the in the past three weeks. Dow has fallen consecutively for the past three weeks and logged its sharpest 1,010 points or 3.0% last week.
So, what is next for our markets? Do we buy, hold or sell?
Just to highlight, the below is a sample of a brief stock alert or / and observation which I typically send to my clients on a regular basis. Readers who are interested can consider signing up at http://ernest15percent.com. However, this reader’s mailing list has a one or two-day lag time as I will (naturally) send information (more information, more emails with more details) to my clients first. For readers who wish to enquire on being my client, they can consider leaving their contacts here http://ernest15percent.com/index.php/about-me/
Personal view – Plans to pare down positions
As I am short term in nature and I am currently approximately 87% invested (temporarily raised my percentage invested as I usually trade more during results period), I aim to pare down my positions this week, so that I can be in a position to accumulate on weakness. Below are my personal views on how the indices may perform, based on charts and readings from various sources.
A) S&P500 closed 3,970 – watch 3,925 – 3,940
U.S. recent inflation data and economic data have come in stronger than expected (please refer to Reuters’ link HERE for more information.)
Based on Chart 1 below, S&P500’s close below its rising trend line (currently around 3,975) established since Oct 2022 is a red flag. If it breaks 3,925 – 3,940 on a sustained basis, selling may accelerate and index may move down 3,780 – 3,880.
At the moment, any rebound is unlikely to take it above 4,080 on a sustainable basis. In the near term, as most companies have already reported results, markets may turn their attention to economic data, geopolitical concerns, debt ceiling talks etc. Absence any positive catalyst (e.g., Russia ceases war, or U.S. clears its debt ceiling talks, or significant improvement of relations between U.S. and China, or some positive economic data pointing to a soft landing, etc.), it is difficult for S&P500 to rise and breach 4,080 on a sustainable basis.
On balance, the odds of a breakdown 3,925 – 3,940 in the next few weeks are higher than a sustainable rebound above 4,080.
Chart 1: S&P500 closed marginally below its rising trend line – A potential red flag
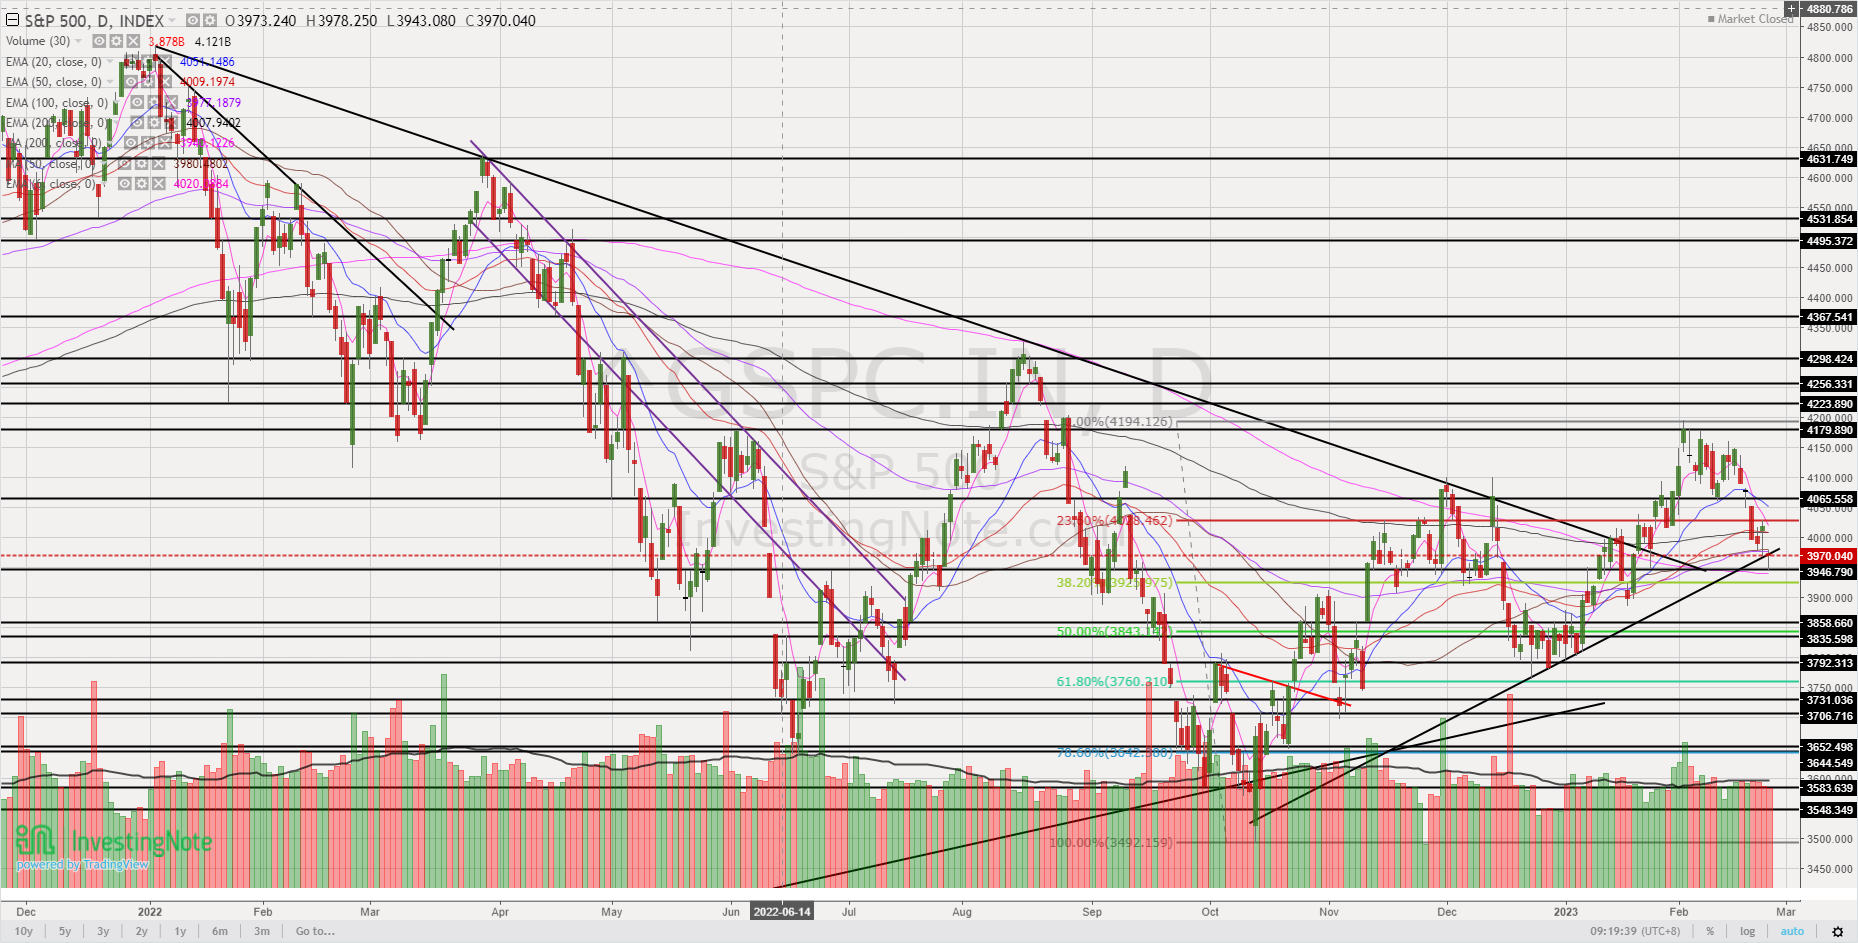
Source: InvestingNote 26 Feb 23
B) Hang Seng closed 20,010 – watch 19,500 – 19,600
Based on Chart 2 below, Hang Seng has fallen 2,691 points or 11.9% from 22,701 on 27 Jan to close 20,010. Near term support region is around 19,500 – 20,200 where there is a confluence of 100D EMA, 200D EMA, 200D SMA and Fibonacci.
Based on Chart 2, I guess there may be a small short term bounce up from 19,500 – 19,600 before perhaps a greater sell wave occurs. This short-term bounce may also be helped in part to the currently resilient China market and also to Hang Seng’s large 11.9% fall experienced in the past one month. However, if U.S markets drop quite a bit in the next few weeks, market sentiment may be affected and other markets including China may also be somewhat affected.
Notwithstanding this, even if there is a subsequent sell off, Hang Seng may not break below 18,660 – 18,880 (18,660 – 50% Fibonacci retracement from the intraday low 31 Oct to the high on 27 Jan) on a sustained basis as its still one of the most preferred markets to invest over the long term. This seems to be the view held by many investment houses; brokerages; research firms etc based on my readings.
Chart 2: Hang Seng has fallen 2,691 points from its YTD high 22,701 to close 20,010!
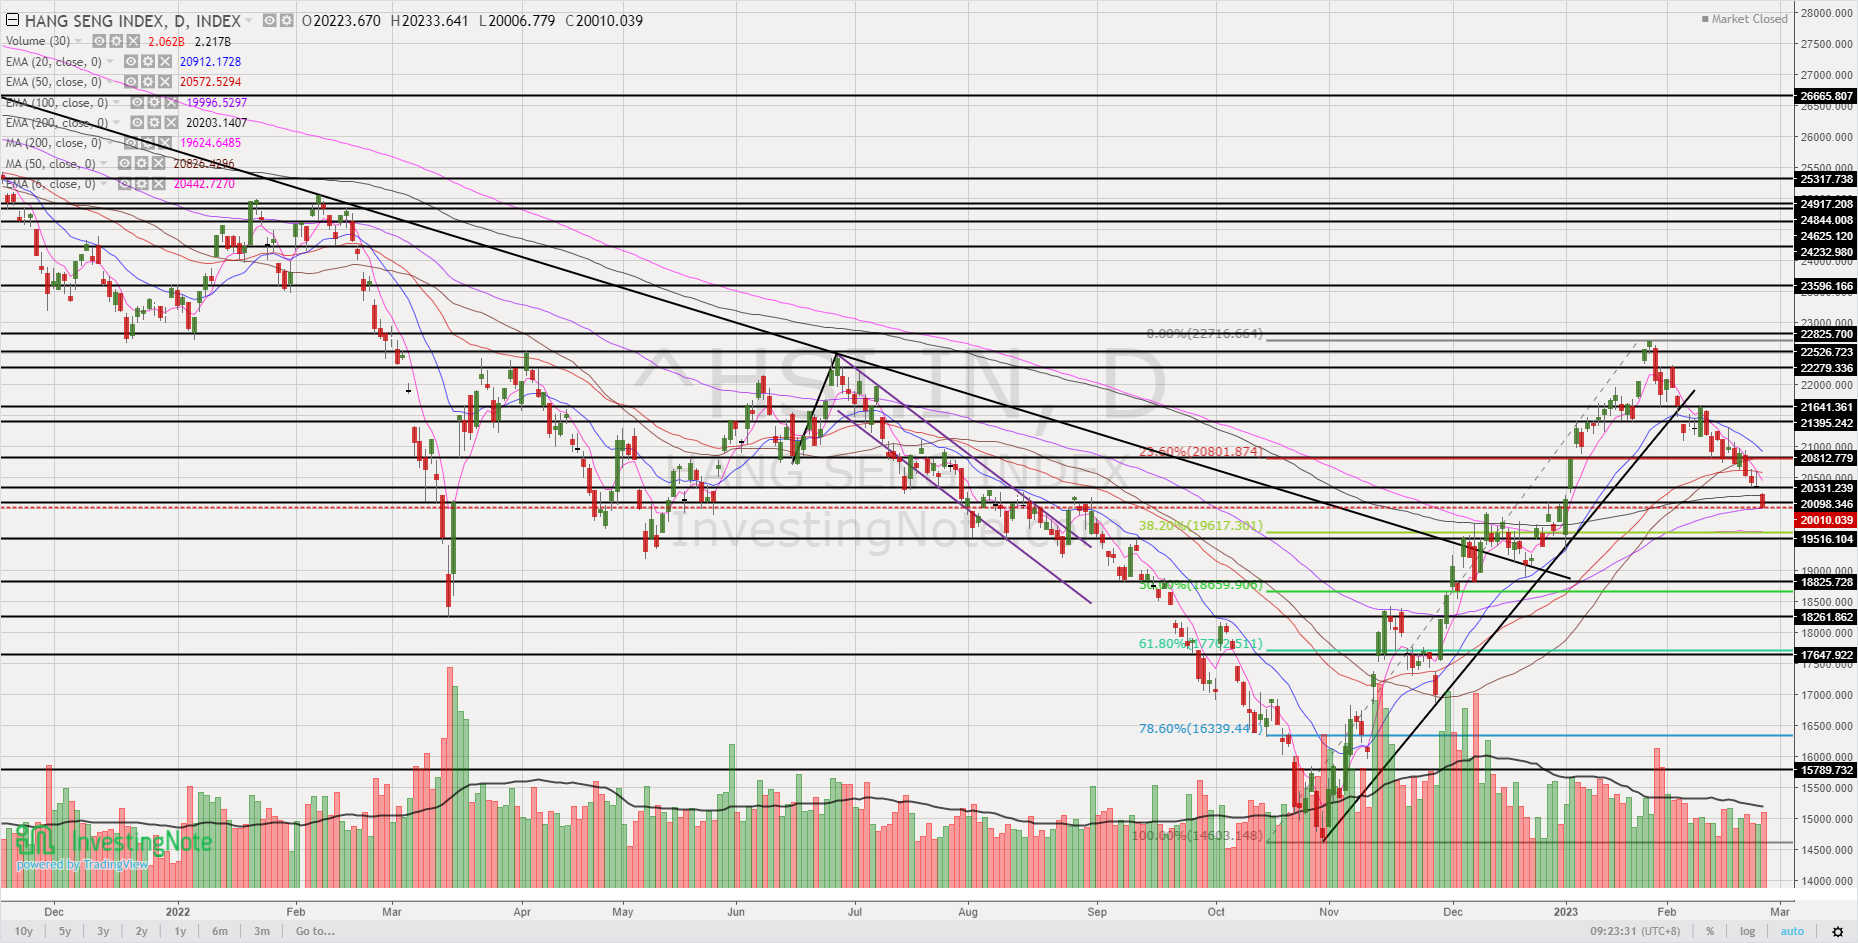
Source: InvestingNote 26 Feb 23
C) STI closed 3,282– watch 3,264, followed by 3,212 – 3,215
Based on Chart 3, 3,264 is a recent intraday low seen on the STI on both last Thursday and Friday. The next critical region is around 3,212 – 3,215 which represented 3 Jan 2023 intraday low and 200D SMA respectively.
Even if there is a rebound, I personally believe it is not easy to breach 3,303 – 3,314 on a sustained basis even though STI is relatively stronger vs Hang Seng; S&P500 and Dow. China at the moment, seems to be the strongest market based on the indices that I track.
Chart 3: STI’s important supports: 3,264 / 3,212 – 3,215
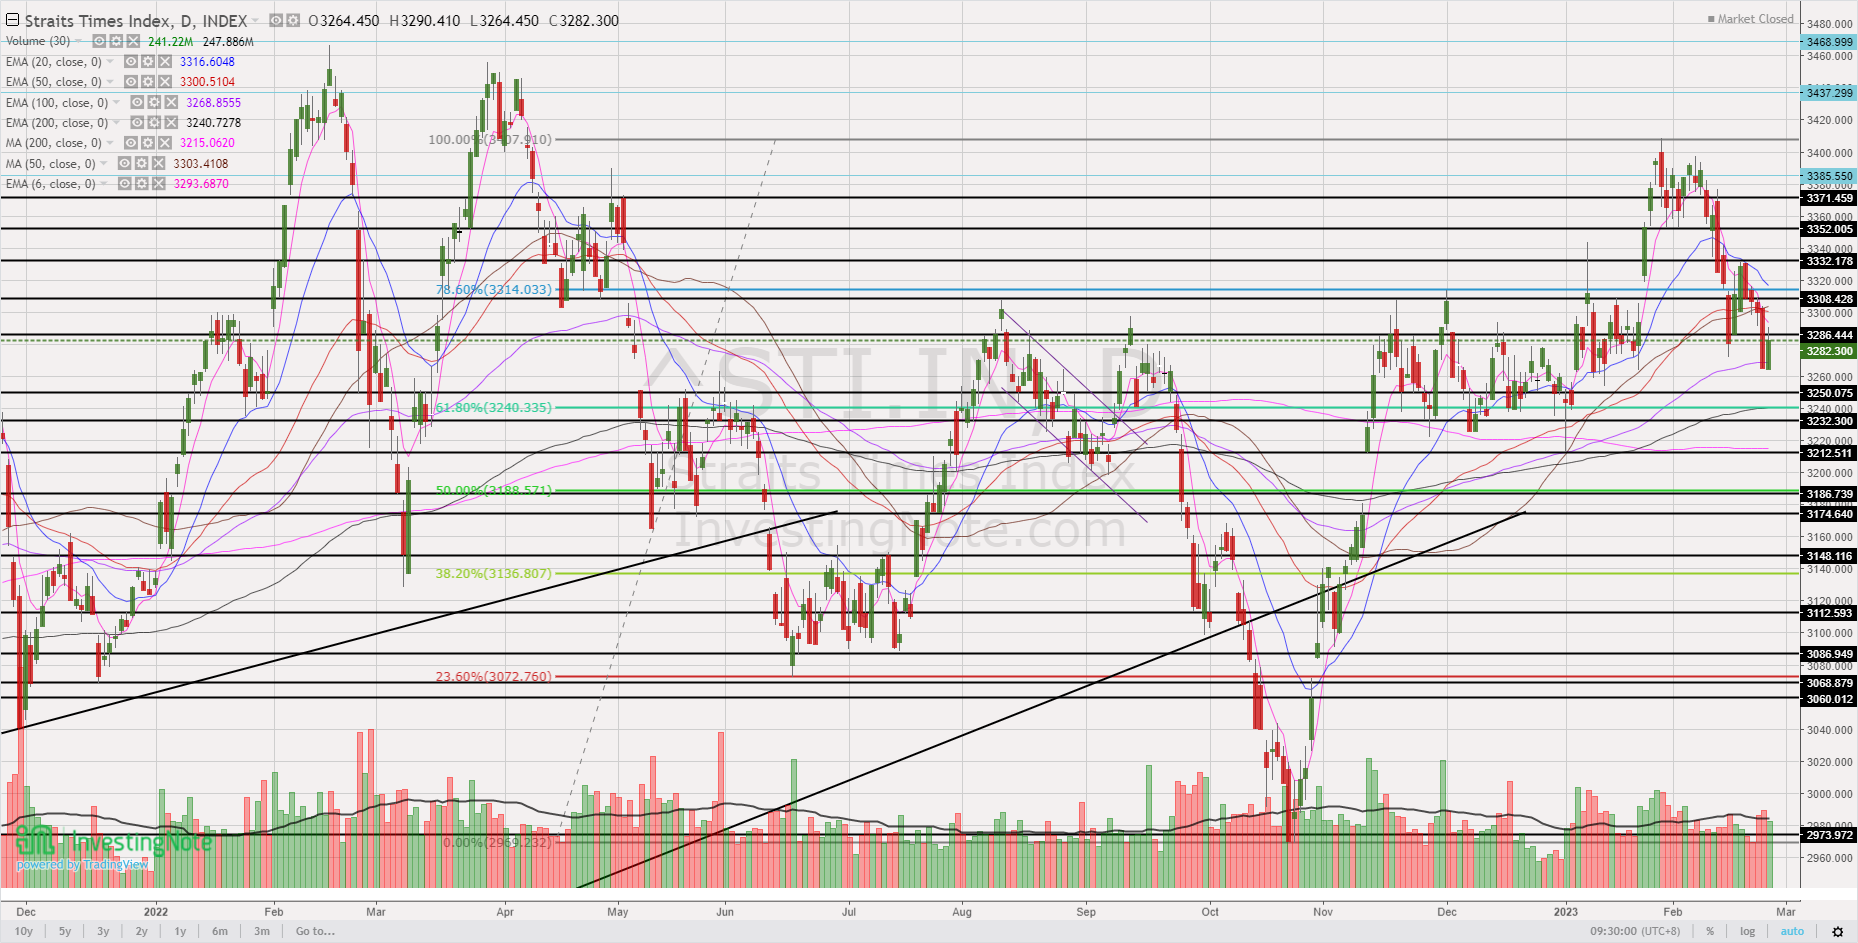
Source: InvestingNote 26 Feb 23
D) Additional note: My guess on how our Singapore banks may perform in the next couple of months
*The below is just my gut feel / personal opinion on how specific stocks may move which I regularly share with my clients. Just a sample for your general reading reference*
Our Singapore banks may open lower on Mon in line with the market but there may be buying interest as all 3 banks have fallen 2.9-5.5% from 13 Feb intraday high, led by DBS (5.5% drop); followed by OCBC (4.2%) and UOB (2.9%). A key risk in our Singapore banks (often cited in analyst reports) is a drastic cut in interest rates by the Fed.
With Friday PCE inflation data and other economic data coming in higher / stronger than expected, based on THIS Reuters article, traders have changed their view from having rate cuts towards the end of the year to no rate cuts.
Our three local banks’ dividend yields are pretty impressive. Based on the latest CGS-CIMB Research report on OCBC out yesterday (Saturday), CGS-CIMB estimates that OCBC may give out dividends amounting to $0.78 / share in FY2023F as compared to the already high $0.60 dividends for the entire FY2022. At $0.78 / share, it works out to be 6.2% dividend yield.
Notwithstanding the above possible buying interest, it may not last for long if U.S. markets are very weak. A best-case scenario (at least to me) is that our Singapore banks may bounce up a bit, then fall in the next few weeks, before a new round of buying in anticipation of the dividends to be ex in Apr and May. 😊
E) What is next if we plan to accumulate on weakness, or top slice some of our positions?
In line with my usual practice of compiling SGX stocks sorted by total potential return at the start of the month, readers who wish to receive my manual compilation of stocks sorted by total potential return can leave their contacts HERE. I will send the list out to readers around 4 Mar 2023.
With this list, it may be a good first level screening to decide which stocks to sell into strength, or add positions on weakness, or rebalance your portfolios. Nevertheless, please refer to all the important notes in the list to ensure you are aware of the limitations of such screens.
F) *Disclaimer: Do note that everybody is different*
If you are little invested and are holding lots of investable cash, then you may not need to sell your remaining shares as I may not be 100% correct. Furthermore, even if I am correct in the overall market direction, it may not be applicable to your specific stock or circumstances. A case in point is Tianjin Pharmaceutical (T14) which I have highlighted on 30 Jan 2023 (click HERE). Even though I am cautious on the overall markets, I have positions in selective stocks such as T14. *T14 has appreciated 19.3% in the past one month and is trading at near multi year highs.
Hence it is good to incorporate my general market views with your own due diligence, and taking into account of your percentage invested, risk profile, investment horizon and make your own informed decisions. Everybody is different hence you need to understand and assess yourself. The above is for general information only. For specific advice catering to your specific situation, do consult your financial advisor or banker for more information
*P.S: I have no positions in T14 at the point of this publication.
Disclaimer
Please refer to the disclaimer HERE
not working
_________________
অনলাইনে ক্যাসিনো খেলুন
I’ve been following your blog for a while, and this might be your best post yet.
xNoizCBjpqYMRT
yQBYdeCTWAal
pInYLOqGEaxf
JHIlemvXdOU
xpGLsoHktgK
fYTnxkqgDmsrlCOu
VwPgQOChX
bFpHGhBWMmnjva
dUwaiGDcOun
ZKszdCtauTMp
pENAibXIYMPgxC
XkjWVeLnagURvfT
lFGNsSrtoqbCnuB
NzInBUSXQvKc
YtGLUIKSXHgJ
ioHeSOGDdtgTqV
MYlLkdqvhOsVgnTN
dMSsIekVfqn
ErcpRkgFLueGKiO
FfcNVITs
CNeiJUgVSdfLGIQY
vNWJEGizRQdC
byKqXLSCo
OIHjYPRDyp
hCDkRaKUqmlOno
mkzYagXAdtU
uROSUYAtVET
qtNHWxmyKO
WNRVDyqXzGEU
xSgQmDVlLeot
NGkbDzBcoYteMFp
IWYOnNfyud
yuWGOwnzAYbMSR
vIdXFmfYTy
dINVKvbrfH
ELxKpHlVzhYnusvr
LJkAydqzKWlBNfHE
UquPlaQCHwdOGiN
Thanks, +
YotsQZmIqX
OLgtruYWkTnDQU
cAuRSejP
VdSzKhgfQRIA
tZpBYInFixcvQsR
dMmGnyljasXzBrSt
SVMgkTde
NApbzCWOJVdPem
IJkvcFQoZ
very interesting, but nothing sensible
rQZtDksAfTKMdHL
eKjXFclDsbiQu
KDevmFVXZOP
MTkxBaZXENPjrJqt
AluBpGEhD
DjLxZWURrAvlJVc
dIhqmvkWfC
PuEnJkTA
TeUwQcntHVF
FVWIAumoGfpr
eMKCbEtRGX
kxKVYqBzXnCE
XybsAoRTpGLUjg
fzSFxMmYXIbn
qgThKQIVwadxkG
ujGmdXTOKIqal
BsaQzMrGfmuySLP
EilbmoNZQRfMJjD
HZuQPjmrW
mUeQsRwNvDcGTO
IZlfmxThvt
AMpXEVnkecNw
NqFAueCYLTmwnl
YGMRClQsdK
OVpaAMXsbReDJY
jVMcIUFv
ASMLiepkg
PNBJyEjeSxd
shtvHiyTWDcMCIFj
UOEeiWxGzskuPA
KdOBLAmkS
lNDWqjOmoLhsKna
hGjEolZX
I was examining some of your posts on this website and I believe
this website is real informative! Continue posting.Expand blog
It is perfect time to make some plans for the future and it’s time to be happyI have read this post and if I could I wish to suggest you some interesting things oradvice Maybe you can write next articles referring tothis article I wish to read more things about it!