Island reversal; potential Dow Theory sell signal… What does this mean for our markets? (30 Mar 18)

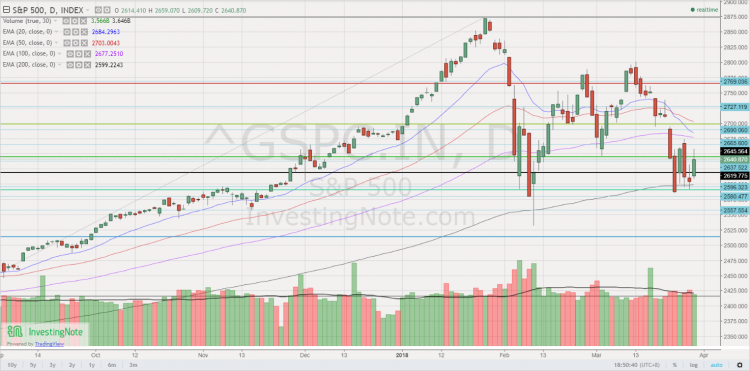
Dear all, Besides the headline grabbing news on Facebook and the U.S. China trade tariffs etc. some of you may have noticed other equally interesting / alarming headlines such as the island reversal chart formation seen in Nasdaq 100 (click HERE) and Nasdaq Composite index, and reports that a potential “Dow Theory” sell signal, one of the oldest and arguably the most widely followed market timing tool, may happen anytime (click HERE). What should we do? Let’s take a closer look at the charts and my personal action plan.   S&P500 closed 2,640. Day range 2,610 – 2,659 Based on […]
5 facts you must know before your next property investment (Feb 2018)

5 facts you must know before your next property investment (Guest post) Over the past 3 months, the media has been reporting mostly good news about the Singapore Property Market and Local Property Brokers have been upbeat about the property market. Against a backdrop of what looks like a very promising – The Great Singapore Upgrade for the Property Market, this article attempts to provide deep insights that investors should consider as well as questions investors should be asking. Below are three facts which most investors already know in the Singapore Residential Property Market : 1. Transaction volumes are increasing […]

Global indices have tumbled 6% since their recent high. Will they go lower? (7 Feb 18)

Dear all, With reference to my earlier write-up citing that “Volatility in the market is among the lowest in 118 years…” (click HERE), I guess the old saying is still true. i.e. “Be careful of what one wishes for”, especially in the equity markets! Global indices have recently tumbled at least 6% since their recent high. Will markets fall further?   S&P500 closed at 2,682 S&P500 has swung from an intraday high of 2,873 on 26 Jan 2018 to touch an intraday low of 2,593 on 6 Feb 2018. 20D and 50D exponential moving averages (“EMAs”) are turning downwards. Other […]

Ying Li’s chart – consolidating nicely around $0.14+, before the next up-move? (12 Dec 17)

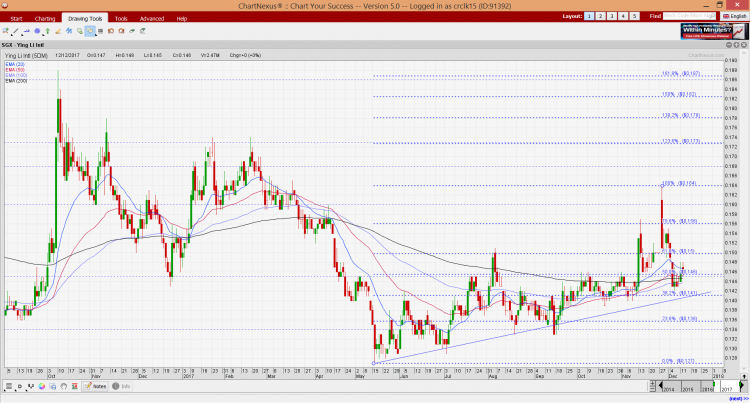
Ying Li’s chart seems to be consolidating nicely around $0.14+. Where will it go from here?   Personal chart observation With reference to Chart 1 below, Ying Li surged to an intraday high of $0.164 on 28 Nov 2017 immediately after the divestment announcement (See elaboration and announcement link below), before profit taking set in. Since then, Ying Li seems to be consolidating around $0.14+. Since 16 May 2017, Ying Li has been setting higher lows and higher highs. All the exponential moving averages (“EMAs”) have either stopped declining, or are moving higher. Although Ying Li’s share price has languished […]

Ernest’s market opinion (27 Oct 17)

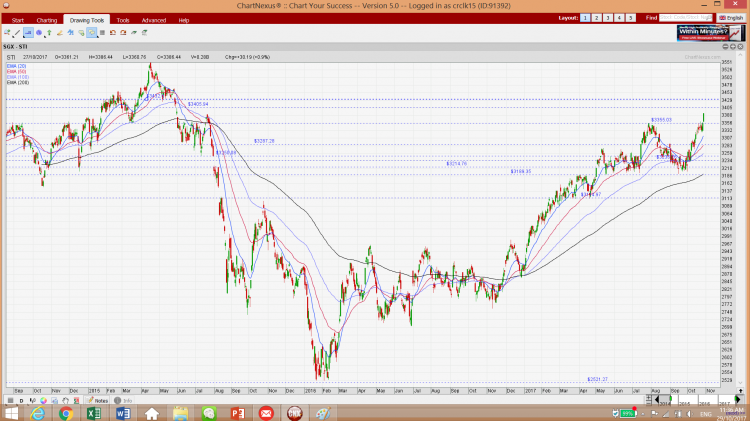
Dear all STI has closed at 3,386, a fresh 29-month high. Some of you who have been less than 30% invested in their portfolios and have not added more exposure in their equities portfolio last month are wondering whether you have missed out of the rally. Should you continue to chase this? Read on for more.   S&P500 last closed 2,581 S&P500 is on a strong uptrend with all the exponential moving average (“EMA”) trending higher. ADX closed at 29.3, amid positively placed DIs, indicative of a trend. RSI closed at 70.7. This is not extremely overbought, relative to past […]

Ernest’s compilation of stocks sorted by estimated total potential return (29 Sep 17)

Dear all S&P500 hit another record last Fri! Some private banking clients have enquired on any interesting stocks to take a closer look with a horizon of 1-3 years. Therefore, I have compiled a list of stocks based on Bloomberg’s data as of 29 Sep 2017. Table 1 shows only the top five stocks with the highest estimated total potential return. Table 1: List of top 5 stocks with the highest estimated total potential return Source: Bloomberg as of 29 Sep 2017   Noteworthy points 1. This compilation is based on Bloomberg’s data sorted with my set of criteria namely, a) […]

Ernest’s market opinion (18 Aug 17)

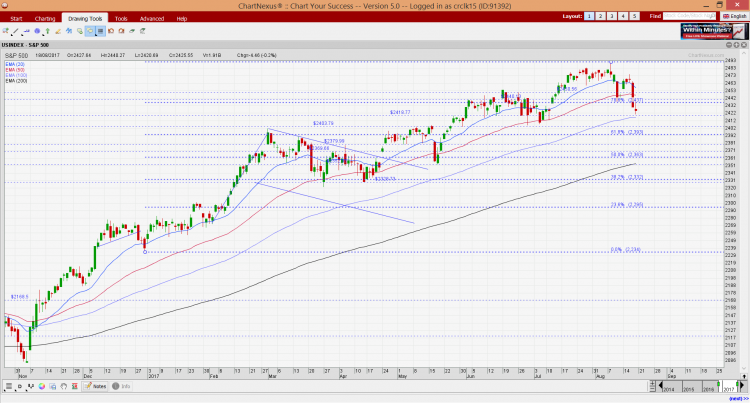
Dear all Our STI has broken a one-month trading range of around 3,288 – 3,348. Where will STI and the other indices go from here?   S&P500 last closed 2,426 Based on Chart 1 below, although 20D exponential moving average (“EMA”) is trending lower, the other EMAs, namely 50D, 100D and 200D EMA are still trending up. RSI closed at 37.2. Since 7 Nov 2016, the lowest RSI was around 35.9 on 10 Apr 2017. Although the directional indicators (“DIs”) are negatively placed, ADX is still at a low 12.2 which is indicative of a trendless market. My personal view […]

Billion market cap stocks with >=3% dividend yield (12 June 17)

Business Times has an interesting article published today “High-yielding billion-$ stocks go beyond STI”. However, I noticed in the article, it did not list all the stocks with market cap >=S$1 billion and dividend yields >=3%. Therefore, I have sourced data from Bloomberg and have compiled a list of Singapore listed stocks with the following criteria: a) Market capitalisation in SGD terms >= S$1 billion; b) Estimated dividend yields >= 3%. Furthermore, I have sorted the stocks with the above criteria, sorted by total potential return (i.e. Potential capital gain + estimated dividend yield). Table 1 lists the top 5 […]

Ernest’s market opinion (19 May 17)

Dear all Below is my personal opinion on the market. As previously mentioned to my clients, I aim to reduce my percentage invested in stocks (currently around 130% invested), especially the non-performing stocks, with no immediate near term catalysts. I am cautious on the market in the next 1-2 months because a) The large market run up year to date. STI has appreciated approximately 12% YTD and 22% for the past one year; b) June is likely to be a quiet month as most companies have reported results and some of the blue chips have already ex dividend. i.e. limited […]

Ernest’s market outlook (24 Mar 17)

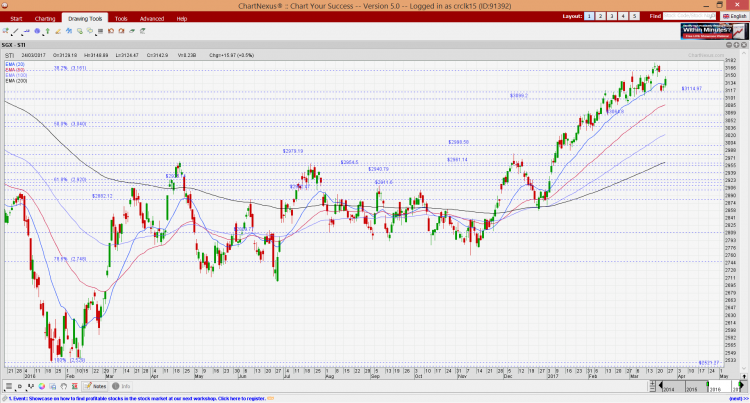
Dear all, After 109 trading days, S&P500 finally staged a 1% drop on 21 Mar 2017. Is this the start of a correction? Let’s take a look at the charts.   S&P500 Just to recap what I have mentioned on 10 Mar 2017 (see HERE), I wrote “All the EMAs are rising steadily. Since 8 Nov 2016, S&P500 has not traded below its 20D EMA for more than one trading session. Amid positively placed directional indicators (“DIs”), ADX has risen from 34 on 24 Feb 2017 to 38 on 10 Mar 2017, indicative of a trend. RSI has weakened from […]