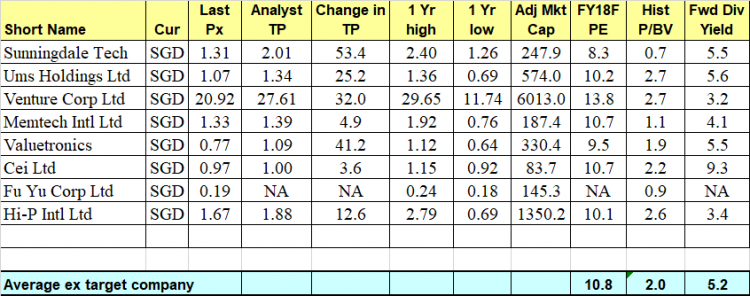
Sunningdale trades at 8.3x FY18F PE; 0.66x P/BV and 5.5% FY18F div yield (30 Apr 18)

Sunningdale has plunged 46% in less than half a year, from an intraday high of $2.40 on 6 Nov 2017 to close $1.30 on 30 Apr 2018. What happened? Is Sunningdale a “goner”?   Some reasons for Sunningdale’s decline Sunningdale’s share price decline may be attributed to some of the reasons below: a) Sentiment on tech sector has soured Sentiment has soured on the tech sector primarily due to downbeat results or / and guidance from tech companies such as Taiwan Semiconductor Manufacturing Co. Ltd, SK Hynix. Secondly, there are rising fears of increasing regulation measures on the tech sector. […]

Venture approaches bear territory! Should we sell? (24 Apr 18)

Dear all, Venture has entered into bear territory after dropping 21% from an intraday high of $29.65 on 13 Apr 2018 to close $23.40 on 24 Apr 2018. What should we do? Let’s examine the chart and some noteworthy points on Venture.   Chart analysis Based on Chart 1 below, Venture’s chart seems to resemble a bearish double top formation. The break below its neckline $26.95 points to an eventual technical measured target $24.60 which is already attained today. 20D, 50D and 100D exponential moving averages (“EMA”) have started to turn lower amid the sharp drop. Venture closed below its […]

Island reversal; potential Dow Theory sell signal… What does this mean for our markets? (30 Mar 18)

Dear all, Besides the headline grabbing news on Facebook and the U.S. China trade tariffs etc. some of you may have noticed other equally interesting / alarming headlines such as the island reversal chart formation seen in Nasdaq 100 (click HERE) and Nasdaq Composite index, and reports that a potential “Dow Theory” sell signal, one of the oldest and arguably the most widely followed market timing tool, may happen anytime (click HERE). What should we do? Let’s take a closer look at the charts and my personal action plan.   S&P500 closed 2,640. Day range 2,610 – 2,659 Based on […]

S&P500 – closed below its 200D EMA – a 1st since Nov 2016! (23 Mar 18)

Dear all, Previously, I mentioned in my write-up dated 21 Mar that I am avoiding the event risk of the U.S. tariff package against Chinese (click HERE). This proves timely as S&P500 fell 129 points, or 4.7% from 2,717 on 20 Mar to close 2,588 on 23 Mar. At 2,588, S&P500 has made its first close below its 200D exponential moving average (“EMA”) since Nov 2016. Why and how is this significant?  During the sharp 10% drop in the first part of Feb 2018, S&P500 has not closed below its 200D EMA. Furthermore, most technical analysts are watching this level […]

Chart alerts for ISOTeam and Singpost (9 May 17)

Two charts have caught my attention, one potentially bullish (Singpost) and the other one potentially bearish (ISOTeam). Below are my personal views.   1. ISOTeam – hanging near critical support Based on Chart 1 below, ISOTeam has been trading in an approximately 10 month range $0.370 – 0.430 since Jul 2016. Most exponential moving averages (“EMAs”) such as 20D, 50D and 100D are sliding and compressing. This compression is usually unsustainable over the long term and may signify a possible significant price movement. ADX closed at 24. Although the directional indicators (“DIs”) are positively placed, +DI is turning downwards quite […]

Trading is easy, isn’t it? [4 Dec 2016] (Part 2)

In my previous article “Trading is easy, isn’t it? [20 Nov 16] (Part 1) click HERE”, I have discussed the importance of one’s psychology in trading. However, I have only given a general outline on risk management and trading system which are also very important topics. In this article, I will elaborate on risk management compiled from various trading books and will add in my thoughts under “–>”.   Risk management – What it ACTUALLY means… Risk management is a set of pre-defined guidelines which serious traders adhere so as to survive in the market over the long term. Risk […]