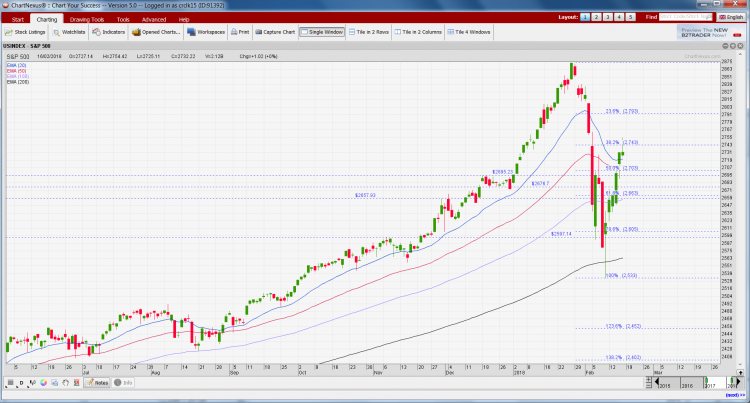
S&P500 – closed below its 200D EMA – a 1st since Nov 2016! (23 Mar 18)

Dear all, Previously, I mentioned in my write-up dated 21 Mar that I am avoiding the event risk of the U.S. tariff package against Chinese (click HERE). This proves timely as S&P500 fell 129 points, or 4.7% from 2,717 on 20 Mar to close 2,588 on 23 Mar. At 2,588, S&P500 has made its first close below its 200D exponential moving average (“EMA”) since Nov 2016. Why and how is this significant?  During the sharp 10% drop in the first part of Feb 2018, S&P500 has not closed below its 200D EMA. Furthermore, most technical analysts are watching this level […]

S&P 500 jumped 4.3% last week, the best performance since Jan 2013! Is the recent sell off over? (18 Feb 18)

Last week, all three U.S. major indices (i.e. DOW, S&P500 and Nasdaq) have registered their best weekly performance in years. Is the recent sell off over? Let’s take a look.   7 observations on the market U.S 10Y bond yield is still relatively high at 2.875% (click HERE) vis-à-vis 2.418% a year ago. If it suddenly surges to around 3%, it may fuel another sell off; Inflation based on several indicators such as core CPI / core PPI released the week of 12 – 16 Feb are rising faster than forecasts. However, market shows limited reaction towards the inflation data […]

Ernest’s market opinion (27 Oct 17)

Dear all STI has closed at 3,386, a fresh 29-month high. Some of you who have been less than 30% invested in their portfolios and have not added more exposure in their equities portfolio last month are wondering whether you have missed out of the rally. Should you continue to chase this? Read on for more.   S&P500 last closed 2,581 S&P500 is on a strong uptrend with all the exponential moving average (“EMA”) trending higher. ADX closed at 29.3, amid positively placed DIs, indicative of a trend. RSI closed at 70.7. This is not extremely overbought, relative to past […]

Hatten Land – poised to breach above $0.210 (26 Sep 17)

Hatten Land (“Hatten”) has been trading in a tight range $0.192 – 0.210 for the past two months. Recently, there seems to be a pick up in the volume traded for the past two days. Hatten’s chart looks positive on several fronts.   Chart analysis Based on Chart 1 below, odds seem high that Hatten may be poised to breach above $0.210 in the next couple of months. This is because a) The recent price increase (albeit mild price increase) is accompanied with volume. On the days which Hatten falls, it is accompanied with lower than average volume; b) A […]

Ernest’s market opinion (18 Aug 17)

Dear all Our STI has broken a one-month trading range of around 3,288 – 3,348. Where will STI and the other indices go from here?   S&P500 last closed 2,426 Based on Chart 1 below, although 20D exponential moving average (“EMA”) is trending lower, the other EMAs, namely 50D, 100D and 200D EMA are still trending up. RSI closed at 37.2. Since 7 Nov 2016, the lowest RSI was around 35.9 on 10 Apr 2017. Although the directional indicators (“DIs”) are negatively placed, ADX is still at a low 12.2 which is indicative of a trendless market. My personal view […]

Chart alerts for ISOTeam and Singpost (9 May 17)

Two charts have caught my attention, one potentially bullish (Singpost) and the other one potentially bearish (ISOTeam). Below are my personal views.   1. ISOTeam – hanging near critical support Based on Chart 1 below, ISOTeam has been trading in an approximately 10 month range $0.370 – 0.430 since Jul 2016. Most exponential moving averages (“EMAs”) such as 20D, 50D and 100D are sliding and compressing. This compression is usually unsustainable over the long term and may signify a possible significant price movement. ADX closed at 24. Although the directional indicators (“DIs”) are positively placed, +DI is turning downwards quite […]

Laggard stocks: Chart outlook for ISOTeam, Midas and Sapphire (17 Mar 17)

Notwithstanding the rally in the equity market, there are some stocks which continue to be laggards and are consolidating around their key support areas. If the market continues to stay buoyant, it may be a matter of time before funds rotate to the following laggard stocks, namely ISOTeam, Midas and Sapphire.   1.ISOTeam closed unchanged $0.390. Day range $0.390 – 0.395. Ave analyst: $0.600 ISOTeam has been testing the support area of around $0.375 – 0.390 for the past four days. Short term exponential moving averages (“EMA”) are moving lower with 20D EMA crossing below 50D EMA. It is fortunate […]

Chart highlights on Midas, Sapphire, Sunpower, Terratech (9 Feb 17)

Dear readers, The animal spirits seem to have finally descended on our Singapore market! Our STI is one of the best performing indices with a blistering 6.4% year to date return. Our FSTS ST Small Cap Index has returned 3.8% year to date. I have highlighted four charts which (I feel) deserve attention. Do note the caveats below.   Midas With reference to my write-up on Midas dated 3 Feb 17 (click HERE), Midas’ inverse head and shoulders pattern seems to be confirmed with the decisive upside break above its 200D exponential moving average (“EMA”) and neckline of around $0.230 […]

Ernest’s market outlook (14 Oct 16)

Dear readers, Although my market outlook is a biweekly issue, the technical outlook for some technical indices has deteriorated and I view it timely to update my clients. See below.   S&P500 Index Just to recap what I have mentioned on 7 Oct 2016 (see HERE), I wrote “all the exponential moving averages (“EMAs) are converging and trending higher. ADX has slipped from 22 on 23 Sep 2016 to 20 on 7 Oct 2016, indicative of a lack of trend. Indicators are neutral and stuck in a range. Although the trend continues to be an uptrend until proven otherwise, my […]

Sino Grandness – on the verge of testing critical supports (26 Sep 16)

Sino Grandness has slumped 45% from an intraday high of $0.785 on 7 Jun 2016 to $0.435 on 26 Sep 2016. Sino Grandness has broken its support at $0.450 on 22 Sep 2016 with a larger than average volume. It is on the verge of testing an important support around $0.415 – 0.425. If this breaks with volume and on a sustained basis, it will be pretty bearish. Based on Chart 1 below, it remains entrenched within a strong downtrend with death crosses forming on its 21D and 200D EMA and 50D and 100D EMA. RSI is trading at around […]