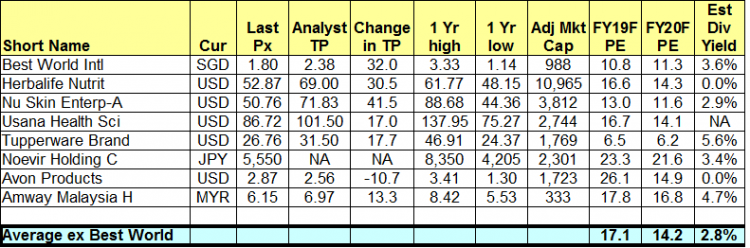
Qualcomm – extremely overbought after a 74% rally within 3 months! (23 Apr 19)

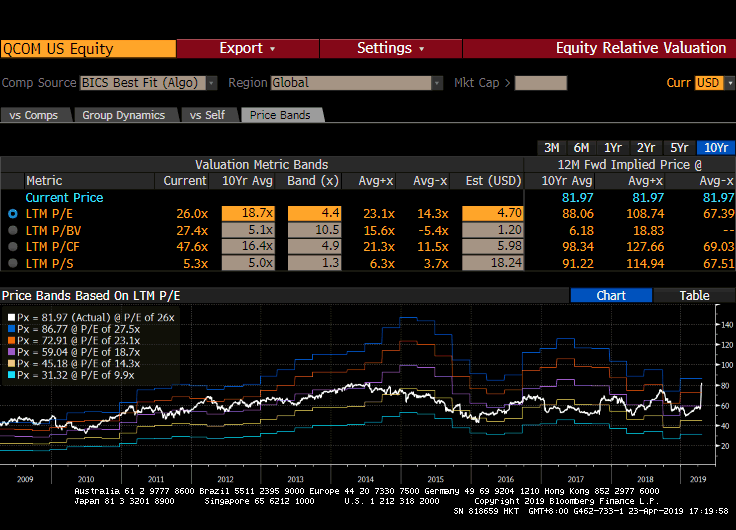
Dear readers, This week, Qualcomm caught my attention as it has appreciated approximately 74% from US$49.10 to trade at US$85.62 in less than 3 months. This is due in part to the favourable announcement that Qualcomm and Apple have reached a multi-year settlement agreement (click HERE for more information)   Why is it interesting? Personally, I think Qualcomm may be a potential short target with a favourable risk to reward proposition with a take profit of a few bids, base mainly on a technical perspective.   Basis to short a) With reference to Chart 1 below, Qualcomm is on a […]

Best World – down 47% in 2 months! Buying opportunity or falling knife? (12 Apr 19)

With reference to my 19 Sep 2018 write-up (click HERE), Best World has appreciated approximately 147% from $1.35 on 19 Sep 2018 to touch an intra-day high of $3.33 on 13 Feb 2019. At that time, Best World has dropped out of my watchlist after its incredible rally. However, with its recent 47% tumble from its all-time intra-day high $3.33 on 13 Feb 2019 to trade $1.76 on 12 Apr 2019, it seems interesting again. Is this a buying opportunity or falling knife?   Why is it interesting? a) Valuations are more attractive now Based on Bloomberg (see Table 1), Best World […]

S&P500 logged its largest one day fall since Jan. Buy more, or head to the exit? (27 Mar 2019)

Dear readers, Last Fri, S&P500 logged its largest one day fall since 3 Jan 2019, due in part to the weak European PMI and the yield curve inversion between U.S. 3-month bill and 10-year note yields. At the time of writing this, Dow closed 0.55% higher on Tues as U.S. 10 year bond yields stabilise. Is last Fri’s fall the precursor to something more serious? Or it is a false alarm?   First things first, what are the reasons for the sharp rally since late Dec? S&P500 has rallied approximately 20.1%, or 471 points from the intra-day low of 2,347 […]

S&P500 has slumped 13.7% in Dec, largest percentage fall since 1931! Has the bull market ended? (23 Dec 18)

Dear all After hitting an intra-day high of 2,941 on 21 Sep 2018, S&P500 has tumbled 17.9% or 525 points to close 2,416 on 21 Dec 2018. In fact, S&P500 has just logged the worst monthly performance in Dec since 1931! Dow has also fallen 3,535 points from the intraday high of 25,980 on 3 Dec 2018 and 4,507 points from the intraday high of 26,952 on 3 Oct 2018. What is happening? Is Armageddon coming?   Most things have not changed since 21 Sep, except for… In Sep, when S&P500 hit 2,940, the usual concerns were also there, namely […]

Sunpower – price action & bullish divergence warrant a closer look (20 Dec 18)

Dear readers, Some of you have sent me emails to express concerns whether I am still maintaining my blog, as I have not posted an article in the past couple of months. Thanks for the concern and emails. It warms my heart that there are readers who are actively following my blog. Something happened to my family which caused me unable to post articles on a timely basis. (My clients are still receiving some periodic short writeups on the market and specific companies during this period) Anyway, I am glad to be back to work this week! This week, Sunpower’s […]

Sunpower slips into bear market territory – Buying opportunity or falling knife? (24 Oct 18)

This week, Sunpower attracts me due partly to the industry which it is in; the recent US$180m investments made by DCP and CDH into Sunpower whose market cap is only around US$206m, and the considerable 40% share price decline since hitting an intra-day high of $0.645 on 28 Jun 2018 to trade $0.385 today. Let’s take a look.   Description of Sunpower Based on Sunpower’s description, it is an environmental protection solutions specialist in proprietary energy saving and clean power technologies. It has two main business segments, viz. Manufacturing & Services (“M&S”) and Green Investments (“GI”). M&S segment comprise of […]

STI has dropped almost 17% since 2 May! Is a bear market coming? (14 Oct 18)

Dear all, U.S. equity markets have logged their worst weekly performance in the past six months. For our local market, STI has dropped 16.7% from an intra-day high of 3,642 on 2 May 2018 to an intra-day low of 3,035 on 11 Oct 2018. It closed at 3,069 on 12 Oct 2018. Is a bear market coming? There are mixed views. Bears are saying that we have not reached the bottom yet. Some perma-bears are even saying this may be the start of the bear market. Bulls are saying that this represents a window of opportunity to accumulate stocks on […]

Sing Medical trades near one year low despite a 70% jump in 1HFY18 net profit! (3 Oct 2018)

This week, Sing Medical (“SMG”) caught my attention. SMG has dropped 39% from $0.725 on 18 Jul 2017 to trade $0.440 on 3 Oct 2018. My personal guess is part of the fall may be attributable to a) Lower, or no earnings growth for some of the healthcare players in FY18F. However, this is likely not the case for SMG, as analysts believe SMG is on track for a minimum 40% growth in FY18F net profit. It is noteworthy that SMG already posted a 70% jump in 1HFY18 net profit; b) Reduction in the general PE valuations ascribed to the […]

Venture approaches bear territory! Should we sell? (24 Apr 18)

Dear all, Venture has entered into bear territory after dropping 21% from an intraday high of $29.65 on 13 Apr 2018 to close $23.40 on 24 Apr 2018. What should we do? Let’s examine the chart and some noteworthy points on Venture.   Chart analysis Based on Chart 1 below, Venture’s chart seems to resemble a bearish double top formation. The break below its neckline $26.95 points to an eventual technical measured target $24.60 which is already attained today. 20D, 50D and 100D exponential moving averages (“EMA”) have started to turn lower amid the sharp drop. Venture closed below its […]

Island reversal; potential Dow Theory sell signal… What does this mean for our markets? (30 Mar 18)

Dear all, Besides the headline grabbing news on Facebook and the U.S. China trade tariffs etc. some of you may have noticed other equally interesting / alarming headlines such as the island reversal chart formation seen in Nasdaq 100 (click HERE) and Nasdaq Composite index, and reports that a potential “Dow Theory” sell signal, one of the oldest and arguably the most widely followed market timing tool, may happen anytime (click HERE). What should we do? Let’s take a closer look at the charts and my personal action plan.   S&P500 closed 2,640. Day range 2,610 – 2,659 Based on […]