Ernest’s market outlook (6 Jan 2017)

Dear readers, Two weeks ago, I mentioned that although Hang Seng is in a downtrend, it may rebound as oversold pressures build. Hang Seng jumped 928 points in the past two weeks. What lies ahead?   S&P500 Index Just to recap what I have mentioned on 23 Dec 2016 (see HERE), I wrote “S&P500 is consolidating its gains for the past two weeks. It continues to be on a clear uptrend amid rising exponential moving averages (“EMAs”). ADX continues to rise from 36 on 9 Dec 2016 to 39 on 23 Dec 2016 on the backdrop of positive placed directional […]

CWG chart looks strong, despite price consolidation (27 Dec 16)

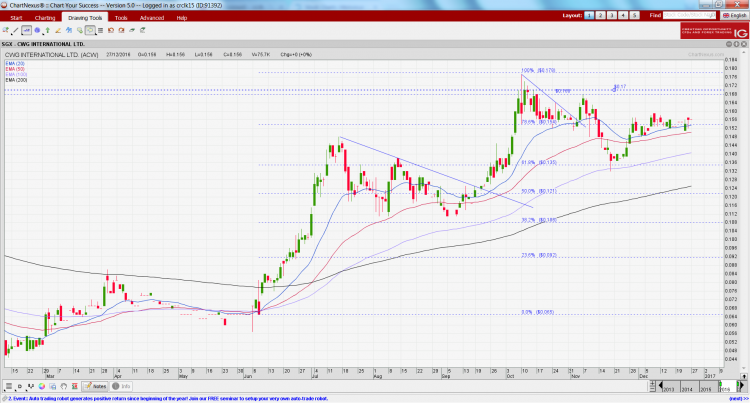
CWG International Limited (“CWG”), former Chiwayland, closed unchanged at $0.156 on 27 Dec 16. Based on Chart 1 below, notwithstanding the recent price consolidation, all its exponential moving averages (“EMAs”) are still rising strongly, indicative of an uptrend. OBV is at elevated levels despite the price consolidation (i.e bullish). Amid positively place directional indicators, ADX is around 25, indicative of a trend. RSI closed at 56. Although the usual benchmark for RSI’s overbought level is around 70, it is noteworthy based on historical records, its RSI can reach 90 before profit taking occurs. All in, the chart looks positive. A […]

Ernest’s market outlook (23 Dec 16)

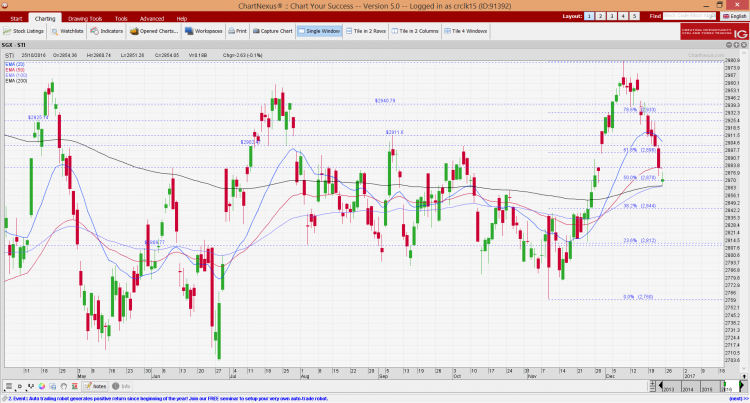
Dear readers, Two weeks ago, I mentioned that there is likely to be profit taking on the STI. STI has since fallen 85 points, or 2.9%. What lies ahead?   S&P500 Index Just to recap what I have mentioned on 9 Dec 2016 (see HERE), I wrote “S&P500 is on a clear uptrend amid rising EMAs and ADX, on the backdrop of positive placed directional indicators (“DIs”). RSI closed around 77 on 9 Dec 2016. This is overbought and at a 3-year high. Indicators such as OBV, MACD and MFI continue to exhibit bearish divergence with price. Although bearish divergences […]

Ernest’s market outlook (14 Oct 16)

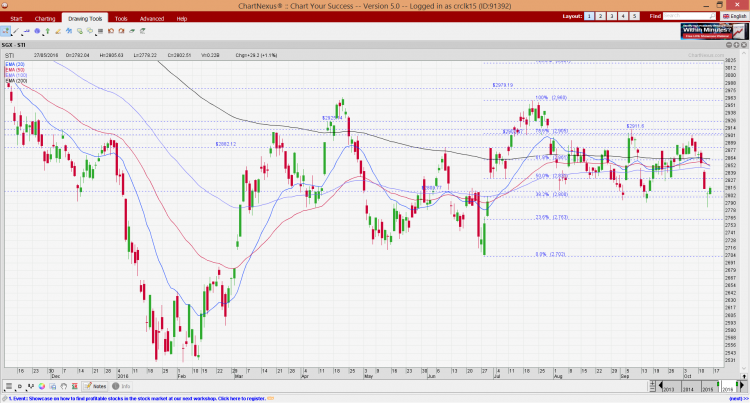
Dear readers, Although my market outlook is a biweekly issue, the technical outlook for some technical indices has deteriorated and I view it timely to update my clients. See below.   S&P500 Index Just to recap what I have mentioned on 7 Oct 2016 (see HERE), I wrote “all the exponential moving averages (“EMAs) are converging and trending higher. ADX has slipped from 22 on 23 Sep 2016 to 20 on 7 Oct 2016, indicative of a lack of trend. Indicators are neutral and stuck in a range. Although the trend continues to be an uptrend until proven otherwise, my […]

Ernest’s market outlook (7 Oct 16)

Dear readers, The recent selective small cap rally seems to be as hot as the China property market! For those who have not benefitted in the recent selective market rally, is it too late to jump on the bandwagon now? Let us take a look at the various broad market indices first.   S&P500 Index Just to recap what I have mentioned on 23 Sep 2016 (see HERE), I wrote “S&P500’s volatility has increased since 9 Sep 2016. RSI has increased around 32 on 9 Sep 2016 to 52 (a neutral level) on 23 Sep 2016. All the exponential moving […]

Selling – When do you sell a stock (18 Sep 16)

Typically, when you read an analyst report, or a news article on a company, or when someone asks you to take a look at a stock with promising prospects, the decision to buy is usually easier, as you are buying on the prospect of potential gains. After your purchase, if the stock subsequently appreciates, or slumps, or stays around the same level for some time, you may wonder what to do with your existing stocks. Through my work as a remisier, I have received extremely frequent (and rather standard) questions from my clients (or sometimes readers), whether they should buy […]

Ernest’s market outlook (9 Sep 16)

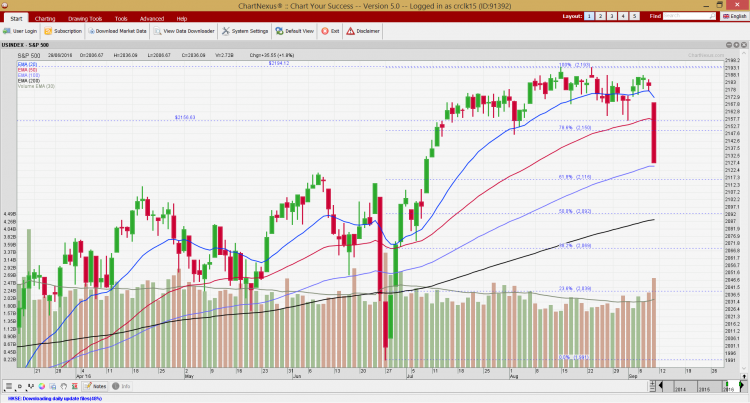
Dear readers, S&P500 finally broke the (one month plus) tight trading range 2,157 – 2,194 with a 2.5% drop yesterday. What’s next? Read on for more.   S&P500 Index Just to recap what I have mentioned on 19 Aug 2016 (see HERE), I wrote “S&P500’s EMAs continue to move higher with a constant degree of separation which is a positive development. However, I am (increasingly) wary of two main factors namely, A) ADX continues to decline from 17.1 on 5 Aug 2016 to 15.9 on 19 Aug 2016, indicative of a lack of trend. B) Indicators such as MACD, MFI […]

Ernest’s STI market outlook (5 Sep 16)

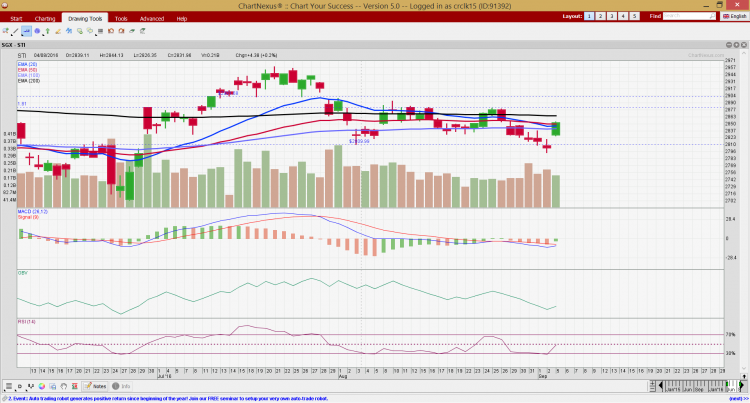
Dear all, I am not able to do the biweekly “Ernest’s market outlook” as I am in the midst of transiting to another chart platform. While I am still exploring Chartnexus, here is my interpretation of our STI chart.   STI Based on Chart 1 below, STI faces a cluster of resistances at 2,865 – 2,870, followed by 2,882. ADX remains weak at 17 on 5 Sep 2016, indicative of a lack of trend. Indicators such as OBV, MFI continue to slide with price. RSI closed at 50.5 today. A sustained break below 2,800 is bearish for the chart. Near […]

Caution ahead? Most market strategists think so… (26 Aug 2016)

Dear readers, Various foreign houses such as Bank of America, Deutsche Bank, Goldman Sachs and UBS etc. are advocating caution in the markets ahead. Some of the commonly cited reasons are valuations; still weak corporate results; U.S. election etc. To be balanced, Morgan Stanley in its 12 Aug 2016 write-up said they continue to be bullish on equities. As you are aware, I operate my portfolio on a short term basis. Based on my views in my previous week market write-up dated 19 Aug 2016 (click HERE), I have reduced my equity allocation from 82% on 19 Aug 2016 to […]

Ernest’s market outlook (19 Aug 16)

Dear readers, S&P500 has met my technical target of around 2,188. What’s next? Read on for more.   S&P500 Index Just to recap what I have mentioned on 5 Aug 2016 (see HERE), I wrote “Notwithstanding the continued bearish divergences indicated by MACD, RSI and the low ADX, my chart outlook continues to be the same as per two weeks ago. S&P500’s exponential moving averages (“EMAs”) continue to move higher with a constant degree of separation which is a positive development. The break above the trading range of 2,034 – 2,111 points to an eventual measured technical target 2,188. Strong […]