Dear all
What a hectic and exciting week! This week, CKH Holdings (00001.HK) (“CKH”) caught my attention with its 19-year low RSI level since end Dec 2000. At the time of writing this, CKH last trades at HKD67.60, level last seen around 21 Feb 2014. With such a precipitous decline, CKH is trading below its 10-year average valuations.
Given the basis below, my personal view is that CKH may be presenting a favourable risk reward setup for a long trade. Do take a look at the basis and more importantly, the risks inherent in such trades.
My personal basis
a) All BUY calls on CKH with an average target price HKD103.27
Based on Figure 1 below, all 14 analysts who cover CKH issue buy calls. This is not an easy feat. Average analyst target HKD103.27, representing a potential capital upside 53%. Estimated div yield is around 4.6%. Total potential return (should consensus be correct) is around 58%.
Figure 1: Average analyst target HKD103.27; total potential upside 58%
Source: Bloomberg 5 Aug 2019
b) Trading at a discount to 10-year valuations
Based on Shareinvestor, CKH’s NAV / share is around HKD115.70. Based on Bloomberg, CKH is trading at 0.60x P/BV and 6.8x current PE; vis-à-vis its 10-year average 8.3x PE and 0.7x P/BV. I.e. CKH is trading at a discount to 10Y average valuations.
c) Price typically rebounds around current level HKD70-72
Based on CKH’s chart, it typically rebounds around its support region HKD70 – 72. This can be seen in Mar 2014; May 2014; Oct 2014 and Jan 2015. Although historical price performance does not guarantee future share price performance, it is still a good gauge of where the buyers may emerge.
d) Chart looks oversold with bullish divergences shown by the indicators
CKH’s technical chart looks interesting on three aspects (see Chart 1 below). Firstly, CKH’s RSI last trades at 13.0 which is an extremely oversold level. In fact, it is the most lowest oversold level since end Dec 2000. Secondly, most indicators (which I use) such as MFI, MACD and OBV are showing bullish divergences which may indicate that the recent slide to HKD67.60 may not be sustainable. Thirdly, CKH has broken below its two-month trading range HKD74.55 – 78.20 with a measured technical target HKD70.90 which has been attained. To some extent, as the downwards measuring objective has already been met, the selling pressure for it to go lower may arguably be lesser.
Near term supports: HKD67.30 / 66.60 / 66.00 / 65.00
Near term resistances: HKD68.90 / 70.00 / 70.90 / 71.30 / 72.50 / 73.50 / 75.00
Chart 1: Entrenched in a strong downtrend but extreme oversold pressures build
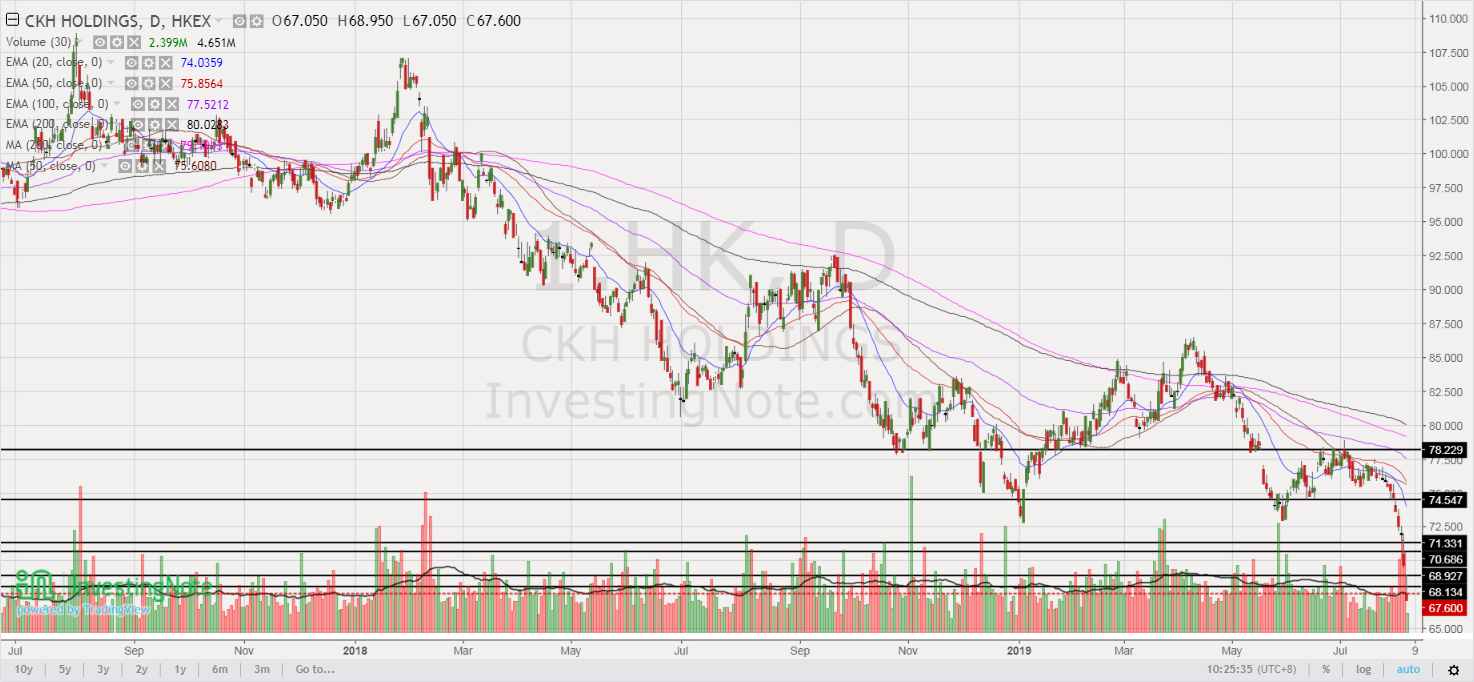
Source: InvestingNote 6 Aug 2019
As usual, with any trading or investment idea, there are always risks. The list below is not exhaustive.
Risks
a) HK protest and trade tension may exert selling pressure
Protests in Hong Kong have stretched for the past two months plus. Such protests undoubtedly will put some adverse pressure on stocks. Furthermore, any worsening of U.S. China trade tensions may also have an adverse impact on stocks.
b) Strong downtrend
Based on Chart 1 above, it is evident that CKH is on a strong downtrend as evidenced by its death cross formations and downwards sloping EMAs. In view of this, take profit levels should be measured and realistic.
c) Not familiar with the company
As this basis is based primarily on its technical oversold level, I am not familiar with CKH’s business and the underlying fundamentals. There may arguably be some reasons known to the market but not to me resulting in the continuous fall in the share price. Readers are encouraged to do your own due diligence. Readers who are not familiar with CKH can take a look at its company website HERE.
d) Chart reading is subjective; no rule that RSI will not go below 13
There is no rule that RSI cannot go below 13, or even 10. However, on the balance of probability, it is less likely that CKH can keep on dropping without some form of bounce, as oversold pressures escalate and amid an overwhelming positive analyst base.
Conclusion
In view of the above, there is no doubt that CKH is on a strong downtrend. However, it seems likely that near term potential downside may be capped, as oversold pressures escalate. I have initiated a long position in this stock via CFDs, with the aim of getting a couple of bids of potential profit if any. This is a trade based on potential retracement, as oversold pressures escalate and not a trend reversal play. Nevertheless, there are significant risks (highlighted above, for example, I am not familiar with CKH’s business and its fundamentals) which we should be aware of. Furthermore, it is noteworthy that as I am a full time remisier, I can change my trading plan fast to capitalize on the markets’ movements (I am not the buy and hold kind). Readers should exercise their due diligence and evaluate carefully. As I have always emphasised, everybody is different hence readers / clients should exercise their independent judgement and carefully consider their percentage invested, returns expectation, risk profile, current market developments, personal market outlook etc. and make their own independent decisions.
Readers who wish to be notified of my write-ups and / or informative emails, can consider signing up at http://ernest15percent.com. However, this reader’s mailing list has a one or two-day lag time as I will (naturally) send information (more information, more emails with more details) to my clients first. For readers who wish to enquire on being my client, they can consider leaving their contacts here http://ernest15percent.com/index.php/about-me/
P.S: I have mentioned to my clients on CKH yesterday and especially today as it seems very interesting indeed.
Disclaimer
Please refer to the disclaimer HERE
Hallo ,You definitely know what youre talking about, why throw away your intelligence on just posting videos to your weblog when you could be giving us something informative to read? thank you
I truly appreciate this post. Want more.
Very neat post. Fantastic.
Hey, thanks for the blog post.Thanks Again. Really Great.
wow, awesome article post.Much thanks again. Want more.
Really informative blog article. Great.
Thanks-a-mundo for the blog.Much thanks again. Want more.
I cannot thank you enough for the blog.Thanks Again. Really Cool.
I really like and appreciate your blog.Really looking forward to read more.
I really like and appreciate your post.Thanks Again. Want more.
A big thank you for your blog article.Much thanks again. Fantastic.
Major thanks for the article. Really Cool.
I really like and appreciate your blog article.Really thank you! Want more.
Major thanks for the blog.Much thanks again. Want more.
Major thanks for the post.Much thanks again.
Thanks-a-mundo for the article post.Really thank you! Great.
I cannot thank you enough for the blog article.Really thank you! Really Cool.
I really like and appreciate your article. Cool.
I cannot thank you enough for the blog.Really looking forward to read more. Awesome.
I am so grateful for your blog article.Really thank you!
Appreciate you sharing, great post.Really looking forward to read more.
Really informative article.Much thanks again. Cool.
Really enjoyed this blog.Really thank you!
Im thankful for the post.Much thanks again. Keep writing.
Im thankful for the article post. Really Great.
I loved your blog post.Really thank you! Much obliged.
Hey, thanks for the post.Really thank you!
I appreciate you sharing this blog.Much thanks again. Awesome.
Im obliged for the article post.Really thank you! Much obliged.
Major thankies for the blog post.Really looking forward to read more. Want more.
Major thanks for the article.Really thank you! Want more.
Thanks for sharing, this is a fantastic article.Much thanks again. Will read on…
Very neat post.Really thank you! Really Great.
Hey, thanks for the blog.Really looking forward to read more.
Major thankies for the article.Thanks Again. Keep writing.
Major thanks for the post. Much obliged.
Very informative post.Really thank you! Keep writing.
Major thanks for the blog. Really Great.
Thank you for your post.Really looking forward to read more. Fantastic.
Thanks for the blog.Much thanks again. Awesome.
Really enjoyed this blog post.Thanks Again. Much obliged.
Muchos Gracias for your blog post. Awesome.
Wow, great blog article.Really looking forward to read more. Want more.
I value the post.Really thank you! Great.
I value the article post.Really thank you!
Im thankful for the blog post.Really looking forward to read more. Want more.
I really liked your article post.Thanks Again. Fantastic.
Hi, It has come to our attention that you are using our client’s photographs on your site without a valid licence. We have already posted out all supporting documents to the address of your office. Please confirm once you have received them. In the meantime, we would like to invite you to settle this dispute by making the below payment of £500. Visual Rights Group Ltd, KBC Bank London, IBAN: GB39 KRED 1654 8703, 1135 11, Account Number: 03113511, Sort Code: 16-54-87 Once you have made the payment, please email us with your payment reference number. Please note that a failure to settle at this stage will only accrue greater costs once the matter is referred to court. I thank you for your cooperation and look forward to your reply. Yours sincerely, Visual Rights Group Ltd, Company No. 11747843, Polhill Business Centre, London Road, Polhill, TN14 7AA, Registered Address: 42-44 Clarendon Road, Watford WD17 1JJ
I cannot thank you enough for the article.Much thanks again. Fantastic.
Really enjoyed this blog article.Thanks Again. Great.
I appreciate you sharing this article post.Really looking forward to read more. Keep writing.
I loved your blog.Thanks Again. Cool.
Say, you got a nice article post.Really looking forward to read more. Great.
Hi, It has come to our attention that you are using our client’s photographs on your site without a valid licence. We have already posted out all supporting documents to the address of your office. Please confirm once you have received them. In the meantime, we would like to invite you to settle this dispute by making the below payment of £500. Visual Rights Group Ltd, KBC Bank London, IBAN: GB39 KRED 1654 8703, 1135 11, Account Number: 03113511, Sort Code: 16-54-87 Once you have made the payment, please email us with your payment reference number. Please note that a failure to settle at this stage will only accrue greater costs once the matter is referred to court. I thank you for your cooperation and look forward to your reply. Yours sincerely, Visual Rights Group Ltd, Company No. 11747843, Polhill Business Centre, London Road, Polhill, TN14 7AA, Registered Address: 42-44 Clarendon Road, Watford WD17 1JJ
Im obliged for the blog.Much thanks again. Really Great.
Hi, It has come to our attention that you are using our client’s photographs on your site without a valid licence. We have already posted out all supporting documents to the address of your office. Please confirm once you have received them. In the meantime, we would like to invite you to settle this dispute by making the below payment of £500. Visual Rights Group Ltd, KBC Bank London, IBAN: GB39 KRED 1654 8703, 1135 11, Account Number: 03113511, Sort Code: 16-54-87 Once you have made the payment, please email us with your payment reference number. Please note that a failure to settle at this stage will only accrue greater costs once the matter is referred to court. I thank you for your cooperation and look forward to your reply. Yours sincerely, Visual Rights Group Ltd, Company No. 11747843, Polhill Business Centre, London Road, Polhill, TN14 7AA, Registered Address: 42-44 Clarendon Road, Watford WD17 1JJ
Hi, It has come to our attention that you are using our client’s photographs on your site without a valid licence. We have already posted out all supporting documents to the address of your office. Please confirm once you have received them. In the meantime, we would like to invite you to settle this dispute by making the below payment of £500. Visual Rights Group Ltd, KBC Bank London, IBAN: GB39 KRED 1654 8703, 1135 11, Account Number: 03113511, Sort Code: 16-54-87 Once you have made the payment, please email us with your payment reference number. Please note that a failure to settle at this stage will only accrue greater costs once the matter is referred to court. I thank you for your cooperation and look forward to your reply. Yours sincerely, Visual Rights Group Ltd, Company No. 11747843, Polhill Business Centre, London Road, Polhill, TN14 7AA, Registered Address: 42-44 Clarendon Road, Watford WD17 1JJ
Hi, It has come to our attention that you are using our client’s photographs on your site without a valid licence. We have already posted out all supporting documents to the address of your office. Please confirm once you have received them. In the meantime, we would like to invite you to settle this dispute by making the below payment of £500. Visual Rights Group Ltd, KBC Bank London, IBAN: GB39 KRED 1654 8703, 1135 11, Account Number: 03113511, Sort Code: 16-54-87 Once you have made the payment, please email us with your payment reference number. Please note that a failure to settle at this stage will only accrue greater costs once the matter is referred to court. I thank you for your cooperation and look forward to your reply. Yours sincerely, Visual Rights Group Ltd, Company No. 11747843, Polhill Business Centre, London Road, Polhill, TN14 7AA, Registered Address: 42-44 Clarendon Road, Watford WD17 1JJ
Very informative blog article.Really looking forward to read more. Awesome.
Hi, It has come to our attention that you are using our client’s photographs on your site without a valid licence. We have already posted out all supporting documents to the address of your office. Please confirm once you have received them. In the meantime, we would like to invite you to settle this dispute by making the below payment of £500. Visual Rights Group Ltd, KBC Bank London, IBAN: GB39 KRED 1654 8703, 1135 11, Account Number: 03113511, Sort Code: 16-54-87 Once you have made the payment, please email us with your payment reference number. Please note that a failure to settle at this stage will only accrue greater costs once the matter is referred to court. I thank you for your cooperation and look forward to your reply. Yours sincerely, Visual Rights Group Ltd, Company No. 11747843, Polhill Business Centre, London Road, Polhill, TN14 7AA, Registered Address: 42-44 Clarendon Road, Watford WD17 1JJ
Hi, It has come to our attention that you are using our client’s photographs on your site without a valid licence. We have already posted out all supporting documents to the address of your office. Please confirm once you have received them. In the meantime, we would like to invite you to settle this dispute by making the below payment of £500. Visual Rights Group Ltd, KBC Bank London, IBAN: GB39 KRED 1654 8703, 1135 11, Account Number: 03113511, Sort Code: 16-54-87 Once you have made the payment, please email us with your payment reference number. Please note that a failure to settle at this stage will only accrue greater costs once the matter is referred to court. I thank you for your cooperation and look forward to your reply. Yours sincerely, Visual Rights Group Ltd, Company No. 11747843, Polhill Business Centre, London Road, Polhill, TN14 7AA, Registered Address: 42-44 Clarendon Road, Watford WD17 1JJ
Hi, It has come to our attention that you are using our client’s photographs on your site without a valid licence. We have already posted out all supporting documents to the address of your office. Please confirm once you have received them. In the meantime, we would like to invite you to settle this dispute by making the below payment of £500. Visual Rights Group Ltd, KBC Bank London, IBAN: GB39 KRED 1654 8703, 1135 11, Account Number: 03113511, Sort Code: 16-54-87 Once you have made the payment, please email us with your payment reference number. Please note that a failure to settle at this stage will only accrue greater costs once the matter is referred to court. I thank you for your cooperation and look forward to your reply. Yours sincerely, Visual Rights Group Ltd, Company No. 11747843, Polhill Business Centre, London Road, Polhill, TN14 7AA, Registered Address: 42-44 Clarendon Road, Watford WD17 1JJ
Great, thanks for sharing this blog.Really looking forward to read more. Great.
Hi, It has come to our attention that you are using our client’s photographs on your site without a valid licence. We have already posted out all supporting documents to the address of your office. Please confirm once you have received them. In the meantime, we would like to invite you to settle this dispute by making the below payment of £500. Visual Rights Group Ltd, KBC Bank London, IBAN: GB39 KRED 1654 8703, 1135 11, Account Number: 03113511, Sort Code: 16-54-87 Once you have made the payment, please email us with your payment reference number. Please note that a failure to settle at this stage will only accrue greater costs once the matter is referred to court. I thank you for your cooperation and look forward to your reply. Yours sincerely, Visual Rights Group Ltd, Company No. 11747843, Polhill Business Centre, London Road, Polhill, TN14 7AA, Registered Address: 42-44 Clarendon Road, Watford WD17 1JJ
Very informative blog.Really looking forward to read more. Really Cool.
Hi, It has come to our attention that you are using our client’s photographs on your site without a valid licence. We have already posted out all supporting documents to the address of your office. Please confirm once you have received them. In the meantime, we would like to invite you to settle this dispute by making the below payment of £500. Visual Rights Group Ltd, KBC Bank London, IBAN: GB39 KRED 1654 8703, 1135 11, Account Number: 03113511, Sort Code: 16-54-87 Once you have made the payment, please email us with your payment reference number. Please note that a failure to settle at this stage will only accrue greater costs once the matter is referred to court. I thank you for your cooperation and look forward to your reply. Yours sincerely, Visual Rights Group Ltd, Company No. 11747843, Polhill Business Centre, London Road, Polhill, TN14 7AA, Registered Address: 42-44 Clarendon Road, Watford WD17 1JJ
Hi, It has come to our attention that you are using our client’s photographs on your site without a valid licence. We have already posted out all supporting documents to the address of your office. Please confirm once you have received them. In the meantime, we would like to invite you to settle this dispute by making the below payment of £500. Visual Rights Group Ltd, KBC Bank London, IBAN: GB39 KRED 1654 8703, 1135 11, Account Number: 03113511, Sort Code: 16-54-87 Once you have made the payment, please email us with your payment reference number. Please note that a failure to settle at this stage will only accrue greater costs once the matter is referred to court. I thank you for your cooperation and look forward to your reply. Yours sincerely, Visual Rights Group Ltd, Company No. 11747843, Polhill Business Centre, London Road, Polhill, TN14 7AA, Registered Address: 42-44 Clarendon Road, Watford WD17 1JJ
Thank you for your post. Really Great.
Awesome blog article.Really looking forward to read more. Great.
I value the article.Really looking forward to read more. Really Cool.
Thanks-a-mundo for the article. Will read on…
Your CBD experience will rely greatly on a number of factors. These include personal bioavailability factors (such as height, weight, and body mass), the strength of your CBD oil product, and the supporting ingredients. In general, CBD has a gentle calming effect for the mind and body. In CBD oil sweets, containing ingredients to boost energy or nutrition, that calming effect can help to focus the mind. In relaxation-based products, that calming effect can be more pronounced — especially CBD products formulated for sleep.Is CBD Legal In The UK?Yes! CBD is legal in the UK, provided the product contains less than 0.2 THC as measured by dry weight.
I value the blog post.Really thank you! Fantastic.
CBD Gummies are a new twist on the CBD supplement, providing a convenient and fun way to get your daily dose of CBD. These chewy sweets are made of CBD and come in a variety of flavours and shapes. They are also THC-free. Gummies are the most convenient way to take CBD.The CBD in these gummies is not a sedative, so it will not make you fall asleep. You should be mindful of your body’s signals to know how much CBD you should take.Some people may feel more energised in the morning or after a workout. In such a situation, best CBD gummies UK can also work as a reminder to drink water or eat a snack. Ingredients in CBD Gummies UK:Before purchasing any sort of CBD gummy, be sure to know what they are made of. Your gummies should come with a certificate of analysis, which certifies that they contain no more than 0.3 percent THC.These certificates will also show that the gummies passed laboratory tests to determine whether they are free of harmful adulterants or pesticides. When shopping for the best CBD Gummies UK, check what’s in them. Many of them contain the CBD isolate, which is devoid of other Cannabinoids. In contrast, full-spectrum Hemp extract contains most Cannabinoids.Full-spectrum gummies may contain traces of THC, but that is minimal. Other common ingredients found are sweeteners and other natural flavours. When buying them, you should also check the ingredients for any allergens. aking CBD Gummies with you to work:Taking CBD gummies with you at work is a convenient way to boost your energy levels and combat anxiety. These tasty treats do not take up much space and will not disturb your day. Besides, there are no obvious side effects that will draw attention to your consumption.These tasty gummies are as harmless as any other supplement or medication. So, you can use them without worrying about being judged or ridiculed.CBD is an effective pain reliever. When taken regularly, these gummies can significantly boost your energy levels. It has been shown that CBD improves the ECS, which regulates sleep-wake cycles. This in turn leads to less pain.CBD gummy is a delicious way to boost your energy levels and get the rest you need at work. For optimal results, use a single dose every day.Are CBD Gummies worth buying?CBD Gummies is a great option for those who is looking to incorporate CBD into their daily routine in a tasty and convenient way. There are several benefits that make them worth considering. Firstly, they provide a easy method of consumption, allowing you to enjoy the benefits of CBD without drawing attention. Secondly, CBD Gummies are pre-dosed, making it easy to control your CBD intake and experiment with different dosages. Additionally, they come in a wide variety of flavours, which adds a fun and delicious twist to your CBD experience. However, it’s important to note that the efficacy of CBD Gummies can vary depending on factors such as the quality of the product, individual metabolism, and the desired effects. What are the potential benefits of CBD gummies in the UK? CBD Gummies in the UK offer a range of potential benefits. CBD engages with the body’s endocannabinoid system, a vital regulator of numerous physiological processes.Consuming CBD Gummies may lead to various benefits such as relaxation, decreased stress or anxiety levels, enhanced sleep quality, cbd gummies for pain and an overall sense of well-being. Some individuals also report CBD Gummies aiding in pain relief, promoting a calm mind, and supporting overall balance.Read more about CBD Gummies can you drive. It is important to keep in mind that the specific benefits can differ among individuals, making it advisable to begin with a lower dosage and gradually adjust as necessary. What is considered a strong CBD gummy? A strong CBD gummy typically refers to a gummy with a higher concentration of CBD. Typically, the strength or the strength of CBD gummies is determined by the quantity of CBD milligrams in each gummy.For example, gummies with 25mg or more per serving are often considered strong. However, what is considered strong for one person may not be the same for another, as individual tolerance and desired effects can vary.To ensure optimal results and accommodate individual requirements. It is crucial to commence with a lower dosage of CBD and make adjustments based on personal needs and the body’s response. Can you take a CBD gummy every day? Taking a CBD gummy every day is generally safe for most individuals. CBD is widely tolerated and does not cause intoxication in most individuals. Nonetheless, it is always advisable to seek advice from a healthcare professional before initiating any new supplementation routine, including CBD.They can provide guidance based on your specific health condition, medications you may be taking, and any potential interactions or considerations. Adhering to the manufacturer’s recommended dosage instructions is of utmost importance. What are the best CBD gummies in the UK? etermining the best CBD Gummies in the UK can depend on various factors such as quality, taste, potency, and customer reviews. Some highly regarded options include BRITISH CANNABIS, ACCESS CBD, CBD by BRITISH CANNABIS, and Elixinol.
Very good blog post.Thanks Again. Fantastic.
Hey, thanks for the post. Cool.
How delicious are our CBD gummies? Don’t just take our word for it, professional football player, John Hartson, said “I take the 4800mg gummies and I love them. I don’t have to worry about missing my CBD, all I do is put the tub in my gym bag and I can take it in between sessions. I can already feel the benefits and the flavours are great”. If that’s still not enough, just check out our amazing 5 star reviews on Trustpilot from over 3000 testimonials from happy customers across the UK. Join the SupremeCBD family today to start benefiting from our incredible edibles. Free UK Delivery on All Orders Over £50 Enjoy FREE UK delivery on all orders of £50 or more. Don’t miss out on this amazing offer and make the most of your CBD experience with our delicious gummies, delivered straight to your door! Shop now and unlock the power of CBD Gummies in the UK
How delicious are our CBD gummies? Don’t just take our word for it, professional football player, John Hartson, said “I take the 4800mg gummies and I love them. I don’t have to worry about missing my CBD, all I do is put the tub in my gym bag and I can take it in between sessions. I can already feel the benefits and the flavours are great”. If that’s still not enough, just check out our amazing 5 star reviews on Trustpilot from over 3000 testimonials from happy customers across the UK. Join the SupremeCBD family today to start benefiting from our incredible edibles. Free UK Delivery on All Orders Over £50 Enjoy FREE UK delivery on all orders of £50 or more. Don’t miss out on this amazing offer and make the most of your CBD experience with our delicious gummies, delivered straight to your door! Shop now and unlock the power of CBD Gummies in the UK
A round of applause for your article.Thanks Again. Great.
Hi, It has come to our attention that you are using our client’s photographs on your site without a valid licence. We have already posted out all supporting documents to the address of your office. Please confirm once you have received them. In the meantime, we would like to invite you to settle this dispute by making the below payment of £500. Visual Rights Group Ltd, KBC Bank London, IBAN: GB39 KRED 1654 8703, 1135 11, Account Number: 03113511, Sort Code: 16-54-87 Once you have made the payment, please email us with your payment reference number. Please note that a failure to settle at this stage will only accrue greater costs once the matter is referred to court. I thank you for your cooperation and look forward to your reply. Yours sincerely, Visual Rights Group Ltd, Company No. 11747843, Polhill Business Centre, London Road, Polhill, TN14 7AA, Registered Address: 42-44 Clarendon Road, Watford WD17 1JJ
Hi, It has come to our attention that you are using our client’s photographs on your site without a valid licence. We have already posted out all supporting documents to the address of your office. Please confirm once you have received them. In the meantime, we would like to invite you to settle this dispute by making the below payment of £500. Visual Rights Group Ltd, KBC Bank London, IBAN: GB39 KRED 1654 8703, 1135 11, Account Number: 03113511, Sort Code: 16-54-87 Once you have made the payment, please email us with your payment reference number. Please note that a failure to settle at this stage will only accrue greater costs once the matter is referred to court. I thank you for your cooperation and look forward to your reply. Yours sincerely, Visual Rights Group Ltd, Company No. 11747843, Polhill Business Centre, London Road, Polhill, TN14 7AA, Registered Address: 42-44 Clarendon Road, Watford WD17 1JJ
Hi, It has come to our attention that you are using our client’s photographs on your site without a valid licence. We have already posted out all supporting documents to the address of your office. Please confirm once you have received them. In the meantime, we would like to invite you to settle this dispute by making the below payment of £500. Visual Rights Group Ltd, KBC Bank London, IBAN: GB39 KRED 1654 8703, 1135 11, Account Number: 03113511, Sort Code: 16-54-87 Once you have made the payment, please email us with your payment reference number. Please note that a failure to settle at this stage will only accrue greater costs once the matter is referred to court. I thank you for your cooperation and look forward to your reply. Yours sincerely, Visual Rights Group Ltd, Company No. 11747843, Polhill Business Centre, London Road, Polhill, TN14 7AA, Registered Address: 42-44 Clarendon Road, Watford WD17 1JJ
Hi, It has come to our attention that you are using our client’s photographs on your site without a valid licence. We have already posted out all supporting documents to the address of your office. Please confirm once you have received them. In the meantime, we would like to invite you to settle this dispute by making the below payment of £500. Visual Rights Group Ltd, KBC Bank London, IBAN: GB39 KRED 1654 8703, 1135 11, Account Number: 03113511, Sort Code: 16-54-87 Once you have made the payment, please email us with your payment reference number. Please note that a failure to settle at this stage will only accrue greater costs once the matter is referred to court. I thank you for your cooperation and look forward to your reply. Yours sincerely, Visual Rights Group Ltd, Company No. 11747843, Polhill Business Centre, London Road, Polhill, TN14 7AA, Registered Address: 42-44 Clarendon Road, Watford WD17 1JJ
Hi, It has come to our attention that you are using our client’s photographs on your site without a valid licence. We have already posted out all supporting documents to the address of your office. Please confirm once you have received them. In the meantime, we would like to invite you to settle this dispute by making the below payment of £500. Visual Rights Group Ltd, KBC Bank London, IBAN: GB39 KRED 1654 8703, 1135 11, Account Number: 03113511, Sort Code: 16-54-87 Once you have made the payment, please email us with your payment reference number. Please note that a failure to settle at this stage will only accrue greater costs once the matter is referred to court. I thank you for your cooperation and look forward to your reply. Yours sincerely, Visual Rights Group Ltd, Company No. 11747843, Polhill Business Centre, London Road, Polhill, TN14 7AA, Registered Address: 42-44 Clarendon Road, Watford WD17 1JJ
Hi, It has come to our attention that you are using our client’s photographs on your site without a valid licence. We have already posted out all supporting documents to the address of your office. Please confirm once you have received them. In the meantime, we would like to invite you to settle this dispute by making the below payment of £500. Visual Rights Group Ltd, KBC Bank London, IBAN: GB39 KRED 1654 8703, 1135 11, Account Number: 03113511, Sort Code: 16-54-87 Once you have made the payment, please email us with your payment reference number. Please note that a failure to settle at this stage will only accrue greater costs once the matter is referred to court. I thank you for your cooperation and look forward to your reply. Yours sincerely, Visual Rights Group Ltd, Company No. 11747843, Polhill Business Centre, London Road, Polhill, TN14 7AA, Registered Address: 42-44 Clarendon Road, Watford WD17 1JJ
Hi, It has come to our attention that you are using our client’s photographs on your site without a valid licence. We have already posted out all supporting documents to the address of your office. Please confirm once you have received them. In the meantime, we would like to invite you to settle this dispute by making the below payment of £500. Visual Rights Group Ltd, KBC Bank London, IBAN: GB39 KRED 1654 8703, 1135 11, Account Number: 03113511, Sort Code: 16-54-87 Once you have made the payment, please email us with your payment reference number. Please note that a failure to settle at this stage will only accrue greater costs once the matter is referred to court. I thank you for your cooperation and look forward to your reply. Yours sincerely, Visual Rights Group Ltd, Company No. 11747843, Polhill Business Centre, London Road, Polhill, TN14 7AA, Registered Address: 42-44 Clarendon Road, Watford WD17 1JJ
Hi, It has come to our attention that you are using our client’s photographs on your site without a valid licence. We have already posted out all supporting documents to the address of your office. Please confirm once you have received them. In the meantime, we would like to invite you to settle this dispute by making the below payment of £500. Visual Rights Group Ltd, KBC Bank London, IBAN: GB39 KRED 1654 8703, 1135 11, Account Number: 03113511, Sort Code: 16-54-87 Once you have made the payment, please email us with your payment reference number. Please note that a failure to settle at this stage will only accrue greater costs once the matter is referred to court. I thank you for your cooperation and look forward to your reply. Yours sincerely, Visual Rights Group Ltd, Company No. 11747843, Polhill Business Centre, London Road, Polhill, TN14 7AA, Registered Address: 42-44 Clarendon Road, Watford WD17 1JJ
Hi, It has come to our attention that you are using our client’s photographs on your site without a valid licence. We have already posted out all supporting documents to the address of your office. Please confirm once you have received them. In the meantime, we would like to invite you to settle this dispute by making the below payment of £500. Visual Rights Group Ltd, KBC Bank London, IBAN: GB39 KRED 1654 8703, 1135 11, Account Number: 03113511, Sort Code: 16-54-87 Once you have made the payment, please email us with your payment reference number. Please note that a failure to settle at this stage will only accrue greater costs once the matter is referred to court. I thank you for your cooperation and look forward to your reply. Yours sincerely, Visual Rights Group Ltd, Company No. 11747843, Polhill Business Centre, London Road, Polhill, TN14 7AA, Registered Address: 42-44 Clarendon Road, Watford WD17 1JJ
Hi, It has come to our attention that you are using our client’s photographs on your site without a valid licence. We have already posted out all supporting documents to the address of your office. Please confirm once you have received them. In the meantime, we would like to invite you to settle this dispute by making the below payment of £500. Visual Rights Group Ltd, KBC Bank London, IBAN: GB39 KRED 1654 8703, 1135 11, Account Number: 03113511, Sort Code: 16-54-87 Once you have made the payment, please email us with your payment reference number. Please note that a failure to settle at this stage will only accrue greater costs once the matter is referred to court. I thank you for your cooperation and look forward to your reply. Yours sincerely, Visual Rights Group Ltd, Company No. 11747843, Polhill Business Centre, London Road, Polhill, TN14 7AA, Registered Address: 42-44 Clarendon Road, Watford WD17 1JJ
Hi, It has come to our attention that you are using our client’s photographs on your site without a valid licence. We have already posted out all supporting documents to the address of your office. Please confirm once you have received them. In the meantime, we would like to invite you to settle this dispute by making the below payment of £500. Visual Rights Group Ltd, KBC Bank London, IBAN: GB39 KRED 1654 8703, 1135 11, Account Number: 03113511, Sort Code: 16-54-87 Once you have made the payment, please email us with your payment reference number. Please note that a failure to settle at this stage will only accrue greater costs once the matter is referred to court. I thank you for your cooperation and look forward to your reply. Yours sincerely, Visual Rights Group Ltd, Company No. 11747843, Polhill Business Centre, London Road, Polhill, TN14 7AA, Registered Address: 42-44 Clarendon Road, Watford WD17 1JJ
Hi, It has come to our attention that you are using our client’s photographs on your site without a valid licence. We have already posted out all supporting documents to the address of your office. Please confirm once you have received them. In the meantime, we would like to invite you to settle this dispute by making the below payment of £500. Visual Rights Group Ltd, KBC Bank London, IBAN: GB39 KRED 1654 8703, 1135 11, Account Number: 03113511, Sort Code: 16-54-87 Once you have made the payment, please email us with your payment reference number. Please note that a failure to settle at this stage will only accrue greater costs once the matter is referred to court. I thank you for your cooperation and look forward to your reply. Yours sincerely, Visual Rights Group Ltd, Company No. 11747843, Polhill Business Centre, London Road, Polhill, TN14 7AA, Registered Address: 42-44 Clarendon Road, Watford WD17 1JJ
Hi, It has come to our attention that you are using our client’s photographs on your site without a valid licence. We have already posted out all supporting documents to the address of your office. Please confirm once you have received them. In the meantime, we would like to invite you to settle this dispute by making the below payment of £500. Visual Rights Group Ltd, KBC Bank London, IBAN: GB39 KRED 1654 8703, 1135 11, Account Number: 03113511, Sort Code: 16-54-87 Once you have made the payment, please email us with your payment reference number. Please note that a failure to settle at this stage will only accrue greater costs once the matter is referred to court. I thank you for your cooperation and look forward to your reply. Yours sincerely, Visual Rights Group Ltd, Company No. 11747843, Polhill Business Centre, London Road, Polhill, TN14 7AA, Registered Address: 42-44 Clarendon Road, Watford WD17 1JJ
Hi, It has come to our attention that you are using our client’s photographs on your site without a valid licence. We have already posted out all supporting documents to the address of your office. Please confirm once you have received them. In the meantime, we would like to invite you to settle this dispute by making the below payment of £500. Visual Rights Group Ltd, KBC Bank London, IBAN: GB39 KRED 1654 8703, 1135 11, Account Number: 03113511, Sort Code: 16-54-87 Once you have made the payment, please email us with your payment reference number. Please note that a failure to settle at this stage will only accrue greater costs once the matter is referred to court. I thank you for your cooperation and look forward to your reply. Yours sincerely, Visual Rights Group Ltd, Company No. 11747843, Polhill Business Centre, London Road, Polhill, TN14 7AA, Registered Address: 42-44 Clarendon Road, Watford WD17 1JJ
Hi, It has come to our attention that you are using our client’s photographs on your site without a valid licence. We have already posted out all supporting documents to the address of your office. Please confirm once you have received them. In the meantime, we would like to invite you to settle this dispute by making the below payment of £500. Visual Rights Group Ltd, KBC Bank London, IBAN: GB39 KRED 1654 8703, 1135 11, Account Number: 03113511, Sort Code: 16-54-87 Once you have made the payment, please email us with your payment reference number. Please note that a failure to settle at this stage will only accrue greater costs once the matter is referred to court. I thank you for your cooperation and look forward to your reply. Yours sincerely, Visual Rights Group Ltd, Company No. 11747843, Polhill Business Centre, London Road, Polhill, TN14 7AA, Registered Address: 42-44 Clarendon Road, Watford WD17 1JJ
Hi, It has come to our attention that you are using our client’s photographs on your site without a valid licence. We have already posted out all supporting documents to the address of your office. Please confirm once you have received them. In the meantime, we would like to invite you to settle this dispute by making the below payment of £500. Visual Rights Group Ltd, KBC Bank London, IBAN: GB39 KRED 1654 8703, 1135 11, Account Number: 03113511, Sort Code: 16-54-87 Once you have made the payment, please email us with your payment reference number. Please note that a failure to settle at this stage will only accrue greater costs once the matter is referred to court. I thank you for your cooperation and look forward to your reply. Yours sincerely, Visual Rights Group Ltd, Company No. 11747843, Polhill Business Centre, London Road, Polhill, TN14 7AA, Registered Address: 42-44 Clarendon Road, Watford WD17 1JJ
Hi, It has come to our attention that you are using our client’s photographs on your site without a valid licence. We have already posted out all supporting documents to the address of your office. Please confirm once you have received them. In the meantime, we would like to invite you to settle this dispute by making the below payment of £500. Visual Rights Group Ltd, KBC Bank London, IBAN: GB39 KRED 1654 8703, 1135 11, Account Number: 03113511, Sort Code: 16-54-87 Once you have made the payment, please email us with your payment reference number. Please note that a failure to settle at this stage will only accrue greater costs once the matter is referred to court. I thank you for your cooperation and look forward to your reply. Yours sincerely, Visual Rights Group Ltd, Company No. 11747843, Polhill Business Centre, London Road, Polhill, TN14 7AA, Registered Address: 42-44 Clarendon Road, Watford WD17 1JJ
Hi, It has come to our attention that you are using our client’s photographs on your site without a valid licence. We have already posted out all supporting documents to the address of your office. Please confirm once you have received them. In the meantime, we would like to invite you to settle this dispute by making the below payment of £500. Visual Rights Group Ltd, KBC Bank London, IBAN: GB39 KRED 1654 8703, 1135 11, Account Number: 03113511, Sort Code: 16-54-87 Once you have made the payment, please email us with your payment reference number. Please note that a failure to settle at this stage will only accrue greater costs once the matter is referred to court. I thank you for your cooperation and look forward to your reply. Yours sincerely, Visual Rights Group Ltd, Company No. 11747843, Polhill Business Centre, London Road, Polhill, TN14 7AA, Registered Address: 42-44 Clarendon Road, Watford WD17 1JJ
Hi, It has come to our attention that you are using our client’s photographs on your site without a valid licence. We have already posted out all supporting documents to the address of your office. Please confirm once you have received them. In the meantime, we would like to invite you to settle this dispute by making the below payment of £500. Visual Rights Group Ltd, KBC Bank London, IBAN: GB39 KRED 1654 8703, 1135 11, Account Number: 03113511, Sort Code: 16-54-87 Once you have made the payment, please email us with your payment reference number. Please note that a failure to settle at this stage will only accrue greater costs once the matter is referred to court. I thank you for your cooperation and look forward to your reply. Yours sincerely, Visual Rights Group Ltd, Company No. 11747843, Polhill Business Centre, London Road, Polhill, TN14 7AA, Registered Address: 42-44 Clarendon Road, Watford WD17 1JJ
Hi there all, here every one is sharing these
familiarity, so it’s fastidious to read this web site, and I used to go to see this weblog everyday.
Can I simply just say what a relief to discover a person that really knows
what they are talking about on the web. You certainly realize how to bring an issue to
light and make it important. A lot more people must read this
and understand this side of the story. I was surprised you
are not more popular because you certainly possess the gift.