GSS Energy potential inverse head and shoulder formation (13 Sep 17)

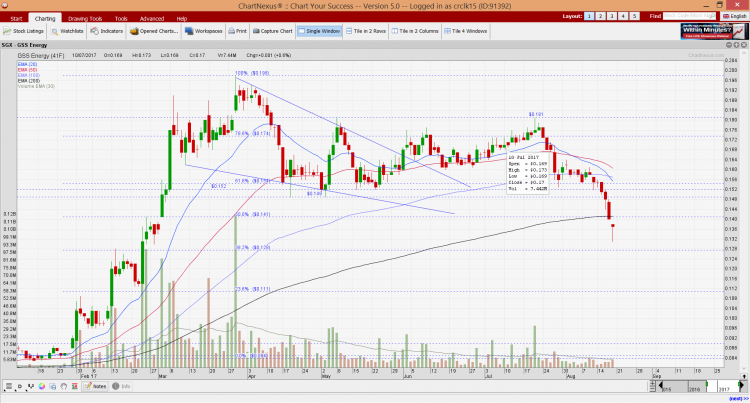
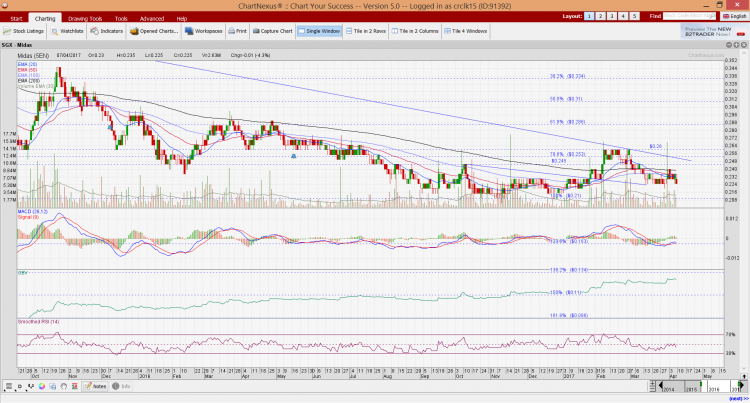
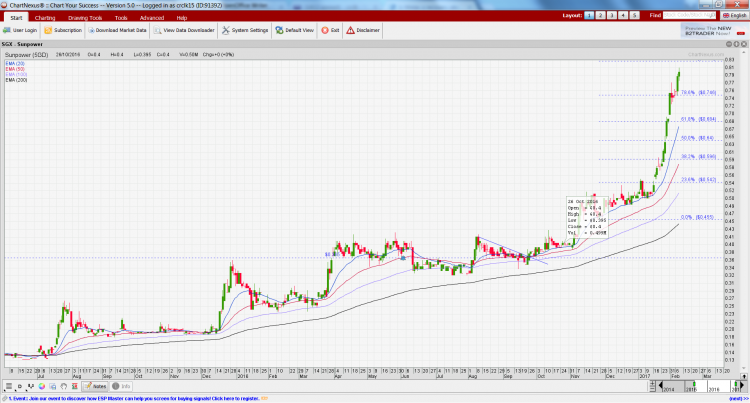
Since my write-up on GSS Energy (“GSS”) dated 18 Aug 2017 (see HERE), GSS’ share price has jumped 12% from $0.137 on 18 Aug 2017 to close at $0.152 on 13 Sep 2017. Based on my personal chart observation, it seems likely to be in the midst of forming a potential bullish inverse head and shoulder formation.   Chart outlook GSS has reclaimed its 200D exponential moving averages (“EMA”) within three trading days after breaching. It has subsequently moved back to its lower trading range of around $0.152. Based on Chart 1 below, there are certain noteworthy points. a) Potential […]
Ernest’s market opinion (18 Aug 17)

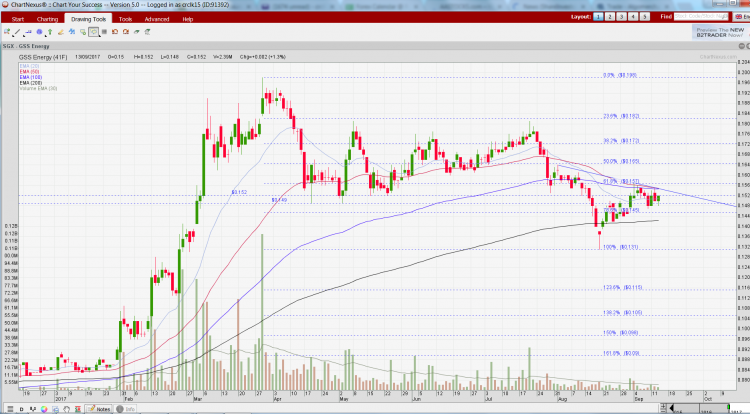
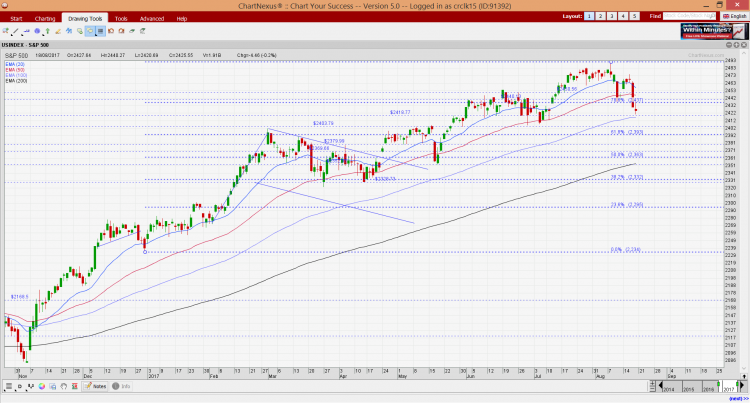
Dear all Our STI has broken a one-month trading range of around 3,288 – 3,348. Where will STI and the other indices go from here?   S&P500 last closed 2,426 Based on Chart 1 below, although 20D exponential moving average (“EMA”) is trending lower, the other EMAs, namely 50D, 100D and 200D EMA are still trending up. RSI closed at 37.2. Since 7 Nov 2016, the lowest RSI was around 35.9 on 10 Apr 2017. Although the directional indicators (“DIs”) are negatively placed, ADX is still at a low 12.2 which is indicative of a trendless market. My personal view […]

GSS Energy dived 31% since 29 Mar 17. What gives? (18 Aug 17)

Since my write-up on GSS Energy (“GSS”) dated 28 Nov 2016 (see HERE), GSS’ share price has surged 154% from $0.078 on 28 Nov 2016 to an intraday high of $0.198 on 29 Mar 2017. It has subsequently dived 31% to close $0.137 on 18 Aug 2017. For chartists who monitor GSS, they would have noted that GSS has broken its 4-month trading range of (approximate) $0.152 – 0.181 which is a bearish development. In this write-up, I will structure it differently. To attempt to explain the price fall, I will discuss what has changed and what has not changed […]

Capital world has tumbled 46% since 29 Mar 17. What gives? Will it fall further? (1 Jun 17)

Capital World (formerly known as Terratech Group Limited) has slumped a whopping 46% from its intraday high of $0.240 on 29 Mar 2017 to close $0.130 on 1 Jun 2017. What has happened to cause such a massive fall? Will it fall further?   Company description Capital World is an innovative property developer that works with landowners on a joint venture basis to create value added property developments. Such joint venture requires minimal capital outlay and maximises investment returns. It is currently developing Project Capital City, an integrated property project comprising a retail mall, hotel and serviced suites and serviced […]

Chart alerts for ISOTeam and Singpost (9 May 17)

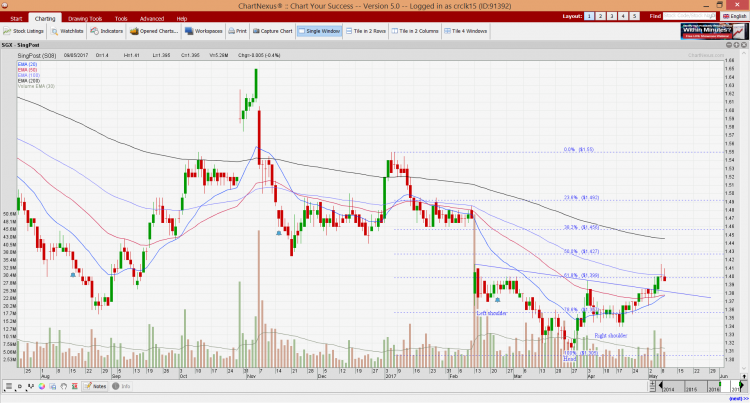
Two charts have caught my attention, one potentially bullish (Singpost) and the other one potentially bearish (ISOTeam). Below are my personal views.   1. ISOTeam – hanging near critical support Based on Chart 1 below, ISOTeam has been trading in an approximately 10 month range $0.370 – 0.430 since Jul 2016. Most exponential moving averages (“EMAs”) such as 20D, 50D and 100D are sliding and compressing. This compression is usually unsustainable over the long term and may signify a possible significant price movement. ADX closed at 24. Although the directional indicators (“DIs”) are positively placed, +DI is turning downwards quite […]

Banyan Tree – collaborations with AccorHotels and Vanke may spark re-rating (17 Apr 17)

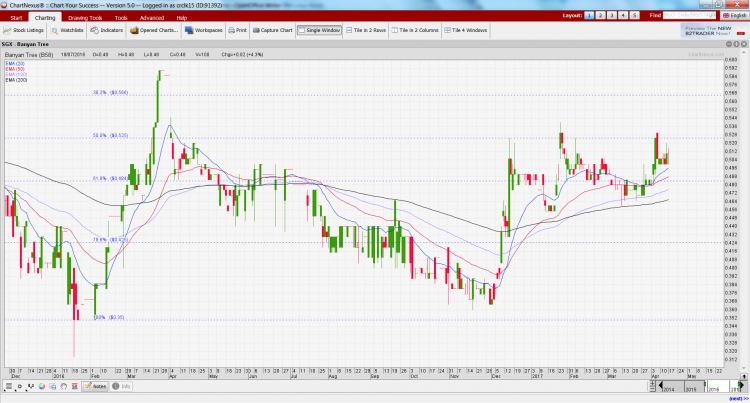
Banyan Tree recently clinched two noteworthy strategic partnership with AccorHotels and Vanke on 8 Dec 2016 and 23 Jan 2017 respectively. Since 23 Jan 2017, Banyan has largely traded between $0.465 – 0.530. It closed at $0.510 on 17 Apr 2017. If a company can catch the eyes of China’s largest property player Vanke and Europe’s largest hotel group / the world’s fifth largest hotel group AccorHotels, there must be some merit to it. I have managed to fix an exclusive 1-1 meeting with Mr Eddy See, Group MD and Mr Clement Ong, Head of Strategic Planning & Investment (“Management”) […]

6 concerns investors have with Midas (7 Apr 17)

Midas has slumped 14% post a 76% growth in its FY16 results. It closed at $0.225 on 7 Apr 2017 which was near the all-time closing low of $0.210. Some of my high net worth clients have told me their concerns on Midas. I have since met Mr Patrick Chew, CEO of Midas and Mr Liaw Kok Feng, CFO Midas for a 1-1 discussion. Here are my key takeaways.   Key takeaways from my concerns posed to the management Concern 1: Orders momentum have slowed for its aluminium extrusion segment According to management, they remain positive for their aluminium extrusion […]

Laggard stocks: Chart outlook for ISOTeam, Midas and Sapphire (17 Mar 17)

Notwithstanding the rally in the equity market, there are some stocks which continue to be laggards and are consolidating around their key support areas. If the market continues to stay buoyant, it may be a matter of time before funds rotate to the following laggard stocks, namely ISOTeam, Midas and Sapphire.   1.ISOTeam closed unchanged $0.390. Day range $0.390 – 0.395. Ave analyst: $0.600 ISOTeam has been testing the support area of around $0.375 – 0.390 for the past four days. Short term exponential moving averages (“EMA”) are moving lower with 20D EMA crossing below 50D EMA. It is fortunate […]

Midas issued positive profit alert! (24 Feb 17)

Dear all, Midas issued a positive profit alert yesterday. It cited “…based on the Board’s preliminary review of the unaudited management accounts of the Group for the year ended 31 December 2016, the Group expects to record a substantial increase by over 70% in its profit attributable to owners of the Company for the year ended 31 December 2016 as compared to the same period of previous year. Such increase was mainly attributable to the contribution from our Aluminium Stretched Plates Division which we completed the acquisition on 27 July 2016.” What does this mean?   My personal take on […]

Chart highlights on Midas, Sapphire, Sunpower, Terratech (9 Feb 17)

Dear readers, The animal spirits seem to have finally descended on our Singapore market! Our STI is one of the best performing indices with a blistering 6.4% year to date return. Our FSTS ST Small Cap Index has returned 3.8% year to date. I have highlighted four charts which (I feel) deserve attention. Do note the caveats below.   Midas With reference to my write-up on Midas dated 3 Feb 17 (click HERE), Midas’ inverse head and shoulders pattern seems to be confirmed with the decisive upside break above its 200D exponential moving average (“EMA”) and neckline of around $0.230 […]