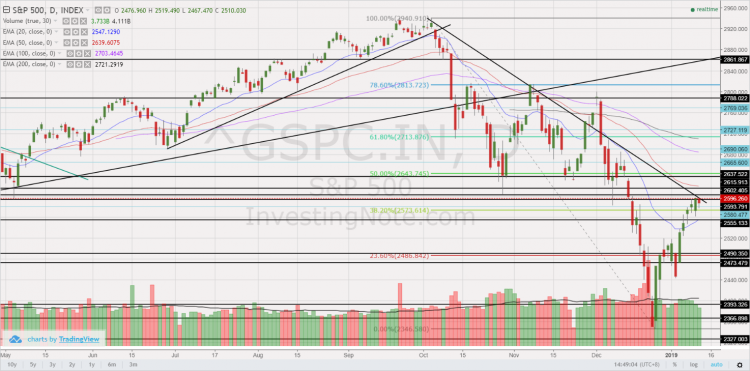
S&P500 has jumped 10.6% since 26 Dec! Should we chase the rally? (12 Jan 2019)

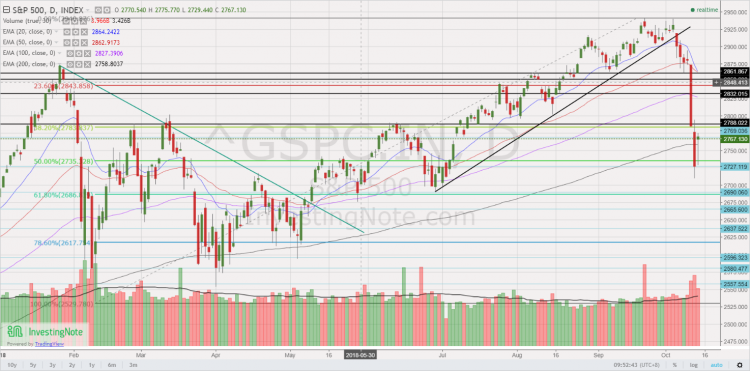
Dear all Since my write-up on 23 Dec 2018 (see HERE), S&P500 has jumped approximately 7.5% since then. In fact, S&P500, after touching an intraday low of 2,347 on 26 Dec 2018, it has risen 249 points or 10.6% to close 2,596 on 11 Jan 2019. Is this the start of another upcycle in equities? Should we chase the rally? Below are some of the positive and negative points which readers can take into consideration before we can arrive to a well thought out answer.   Potential positive points supporting the continuous rally a) Fed may acknowledge rising risks to […]
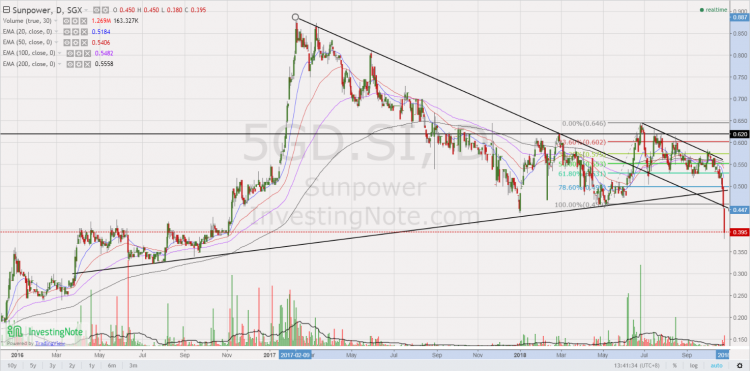
Sunpower slips into bear market territory – Buying opportunity or falling knife? (24 Oct 18)

This week, Sunpower attracts me due partly to the industry which it is in; the recent US$180m investments made by DCP and CDH into Sunpower whose market cap is only around US$206m, and the considerable 40% share price decline since hitting an intra-day high of $0.645 on 28 Jun 2018 to trade $0.385 today. Let’s take a look.   Description of Sunpower Based on Sunpower’s description, it is an environmental protection solutions specialist in proprietary energy saving and clean power technologies. It has two main business segments, viz. Manufacturing & Services (“M&S”) and Green Investments (“GI”). M&S segment comprise of […]

STI has dropped almost 17% since 2 May! Is a bear market coming? (14 Oct 18)

Dear all, U.S. equity markets have logged their worst weekly performance in the past six months. For our local market, STI has dropped 16.7% from an intra-day high of 3,642 on 2 May 2018 to an intra-day low of 3,035 on 11 Oct 2018. It closed at 3,069 on 12 Oct 2018. Is a bear market coming? There are mixed views. Bears are saying that we have not reached the bottom yet. Some perma-bears are even saying this may be the start of the bear market. Bulls are saying that this represents a window of opportunity to accumulate stocks on […]

Sing Medical trades near one year low despite a 70% jump in 1HFY18 net profit! (3 Oct 2018)

This week, Sing Medical (“SMG”) caught my attention. SMG has dropped 39% from $0.725 on 18 Jul 2017 to trade $0.440 on 3 Oct 2018. My personal guess is part of the fall may be attributable to a) Lower, or no earnings growth for some of the healthcare players in FY18F. However, this is likely not the case for SMG, as analysts believe SMG is on track for a minimum 40% growth in FY18F net profit. It is noteworthy that SMG already posted a 70% jump in 1HFY18 net profit; b) Reduction in the general PE valuations ascribed to the […]

Yangzijiang – 2nd worst performing STI stock with -40% YTD (6 Aug 2018)

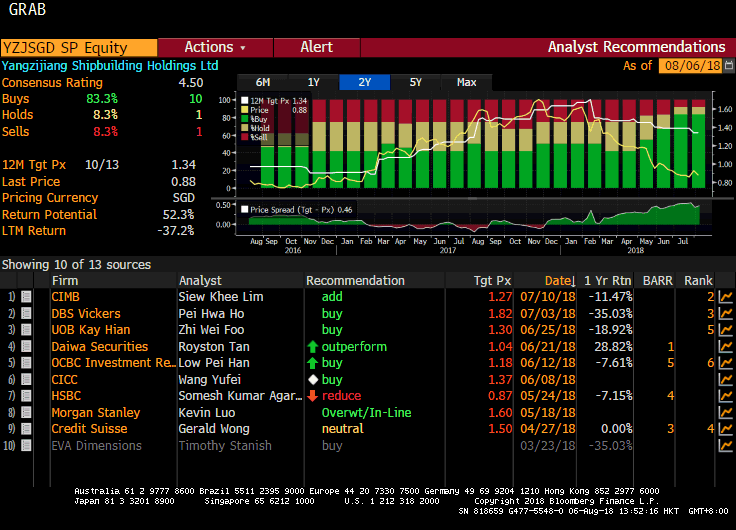
Yangzijiang (“YZJ”) has been the 2nd worst performing STI stock with -40% year to date (“YTD”) return based on the closing price of $0.880 on 6 Aug 2018 (click HERE). In the past four days, YZJ has weakened approximately 9.3% after hitting the intraday high of $0.970 on 31 Jul 2018. Is this recent share price decline the harbinger of poor results to be released on 7 Aug, after market?   2QFY18 results unlikely to be poor Based on my personal view, 2QFY18F results are unlikely to be poor based on the following points: a) Number of vessels delivered Based […]

REC Insights Part 1 of 3: Prime Property at near Mass Market Prices? (26 Apr 18)

REC Insights is a 3 part series hopes to provide insights to investors looking for opportunities in the Singapore Property Market. These insights will be accompanied with detailed, straight to the point analysis. These insights are purely my personal opinion only and do not constitute any investment advice. In the previous article “5 things you must know before your next property investment” (Click HERE), I discussed about higher vacancy rates, rising interest rates and a potential oversupply situation from 2021 onwards. In addition to the previous discussed points, many Singaporeans would say that salary has not risen, or has not […]

Markets – whipsawed by multiple events (20 Mar 18)

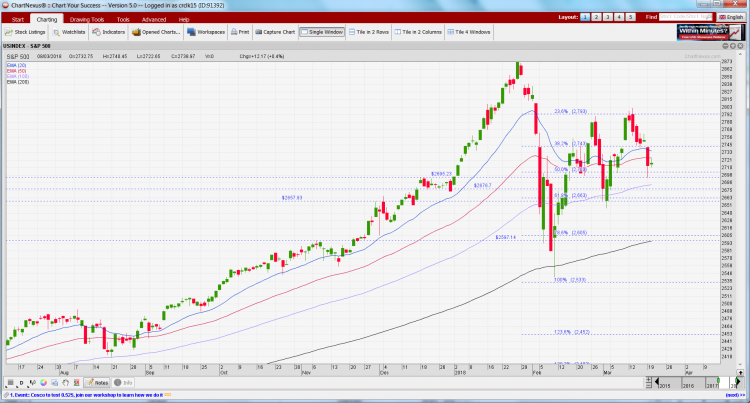
Our markets have been whipsawed by multiple events, such as rising inflation expectations and bond yields, protectionism (for e.g. Trade tariffs), upcoming FOMC meeting and sudden key personnel changes in the White House etc… How should we react or trade in current market conditions? Let’s take a look at the market events and the indices’ charts…   5 observations on the market Fed Chairman Jerome Powell’s first FOMC meeting tonight. A 25bps rate hike is almost certainly expected but markets will be scrutinising what the new Fed Chairman will be saying during the conference; Based on an article on Washington […]

Ernest’s market opinion (10 Nov 17)

Dear all STI has closed at 3,420, in line with my view that STI’s chart continues to be bullish (refer to my technical write-up on STI HERE), despite the elevated RSI.   1. Equities – still favour over bonds over 3-5 year time frame but… Personally, notwithstanding the market rally, I believe that over the long term, equities are still likely to outperform bonds and cash. Having said that, I am not telling all my clients to plough everything into stocks NOW, given that in the near term, there may not be significant catalysts to push the market higher by […]

CWG chart looks strong, despite price consolidation (27 Dec 16)

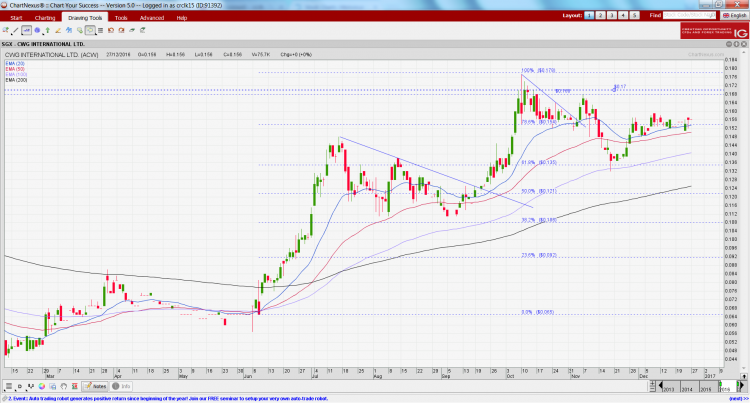
CWG International Limited (“CWG”), former Chiwayland, closed unchanged at $0.156 on 27 Dec 16. Based on Chart 1 below, notwithstanding the recent price consolidation, all its exponential moving averages (“EMAs”) are still rising strongly, indicative of an uptrend. OBV is at elevated levels despite the price consolidation (i.e bullish). Amid positively place directional indicators, ADX is around 25, indicative of a trend. RSI closed at 56. Although the usual benchmark for RSI’s overbought level is around 70, it is noteworthy based on historical records, its RSI can reach 90 before profit taking occurs. All in, the chart looks positive. A […]

Ernest’s market outlook (23 Sep 16)

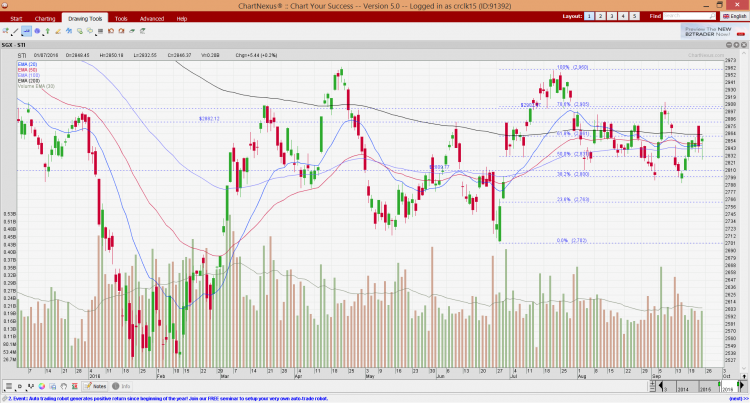
Dear readers, S&P500 reached my measured technical target of 2,120 and rebounded. STI continues to be trapped in a range. What’s next?   S&P500 Index Just to recap what I have mentioned on 9 Sep 2016 (see HERE), I wrote “The break below 2,157 on 9 Sep 2016 points to an eventual measured technical target of around 2,120. With this sharp plunge, RSI has declined from 59 on 19 Aug 2016 to around 32 on 9 Sep 2016. It is noteworthy that since Aug 2015, S&P500 typically staged a rebound when RSI reached around 27 – 32. Amid the sharp […]