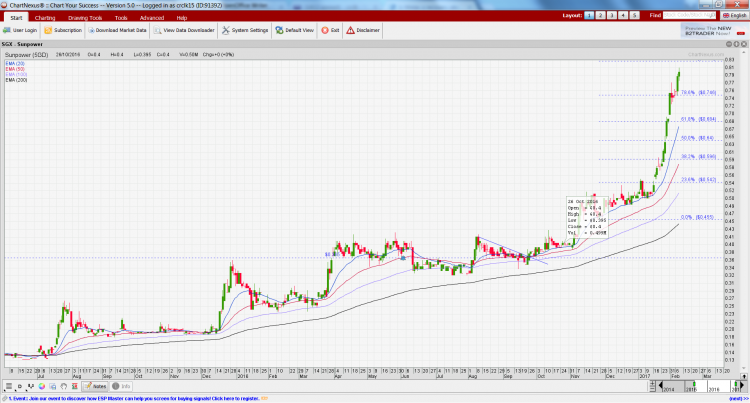
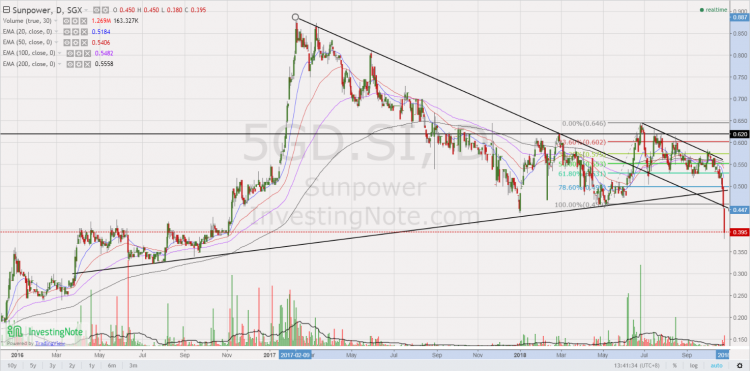
Sunpower slips into bear market territory – Buying opportunity or falling knife? (24 Oct 18)

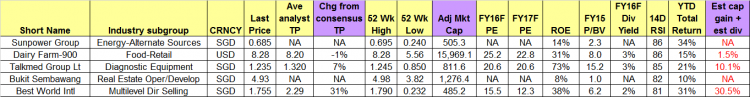
This week, Sunpower attracts me due partly to the industry which it is in; the recent US$180m investments made by DCP and CDH into Sunpower whose market cap is only around US$206m, and the considerable 40% share price decline since hitting an intra-day high of $0.645 on 28 Jun 2018 to trade $0.385 today. Let’s take a look.   Description of Sunpower Based on Sunpower’s description, it is an environmental protection solutions specialist in proprietary energy saving and clean power technologies. It has two main business segments, viz. Manufacturing & Services (“M&S”) and Green Investments (“GI”). M&S segment comprise of […]

STI has dropped almost 17% since 2 May! Is a bear market coming? (14 Oct 18)

Dear all, U.S. equity markets have logged their worst weekly performance in the past six months. For our local market, STI has dropped 16.7% from an intra-day high of 3,642 on 2 May 2018 to an intra-day low of 3,035 on 11 Oct 2018. It closed at 3,069 on 12 Oct 2018. Is a bear market coming? There are mixed views. Bears are saying that we have not reached the bottom yet. Some perma-bears are even saying this may be the start of the bear market. Bulls are saying that this represents a window of opportunity to accumulate stocks on […]

Two interesting stock charts – Best World and Tencent (12 Oct 18)

Notwithstanding the sea of red in the equity markets for the past couple of days, these two stock charts caught my attention. They are Best World and Tencent.   Best World – retreats back to double bottom neckline Best World has dropped 9.2% from an intra-day high of $1.52 on 4 Oct 2018 to close $1.38 on 11 Oct 2018. Based on Chart 1 below, Best World is retreating back to its double bottom neckline of around $1.39. This seems to be a classic “break and re-test” resistance turned support pattern. There is a confluence of supports (50D, 100D and […]

Singtel hits multi-year low and all time oversold since 2000! (3 Jul 2018)

Singtel closed -$0.03 to $3.02, the lowest close since Jun 2012. Based on Bloomberg, it is trading at approximately 5.9% estimated div yield. Ave analyst target is around $3.92. Hence total potential upside is around 35.7%. What has happened to Singtel which hit multi-year lows despite analysts’ buy calls? Is this a buying opportunity? Or is it a falling knife?   Singtel – takeaways from some analyst reports The recent weakness in Singtel may be attributed to its challenging industry, especially when the industry faces new entrants in both Singapore and Australia. Although Singtel may lack near term catalysts, based […]

STI – down 9.4% since 2 May. Correction coming, or buying opportunity? (19 Jun 18)

With reference to my market outlook HERE posted on 11 May 2018, I mentioned at that time that I  have started to sell into strength, as I am cautious on the overall market. I updated on 30 May 2018 (click HERE) that STI is likely to trade sideways with downward bias. Separately, my clients would have been notified on 12 Jun 2018 morning that I have already reduced my percentage invested to approximately 40% as I believe market is likely to trend downwards in the next couple of weeks. In the span of four trading days, STI has dropped 148 […]

ThaiBev drops to almost a two-year low. Will it go lower? (23 Feb 18)

ThaiBev has dropped 12% from an intraday high of $0.920 on 14 Feb 2018 (before the results) to trade at $0.810 on 23 Feb 2018. At $0.810, this was the lowest last seen on 13 May 2016. Will it go lower?   Chart analysis Based on Chart 1 below, ThaiBev is entrenched in a strong downtrend with all the exponential moving averages (EMAs) moving lower, coupled with death cross formations. The breakdown at $0.895 points to an eventual measured technical target of $0.805 which is attained today. Since its result release on 14 Feb after market, the volume of shares […]

Ernest’s market opinion (27 Oct 17)

Dear all STI has closed at 3,386, a fresh 29-month high. Some of you who have been less than 30% invested in their portfolios and have not added more exposure in their equities portfolio last month are wondering whether you have missed out of the rally. Should you continue to chase this? Read on for more.   S&P500 last closed 2,581 S&P500 is on a strong uptrend with all the exponential moving average (“EMA”) trending higher. ADX closed at 29.3, amid positively placed DIs, indicative of a trend. RSI closed at 70.7. This is not extremely overbought, relative to past […]

Hatten Land – extremely oversold RSI 15; Analyst TP: $0.435 vs closing price $0.183 (23 May 17)

Hatten Land has dropped 39% from an intraday high of $0.300 on 28 Feb 2017 to close $0.183 on 23 May 2017. What has caused the sharp decline? Where is the bottom?   Possible reasons for the decline Personally, I believe the recent decline may be attributed in part to the following: a) Hatten reported losses for its 3QFY17 results due mainly to the RM87.8m expenses incurred in relation to the professional fees and acquisition costs arising from the Reverse Takeover exercise (“RTO”). It is noteworthy that these expenses are once off and non-cash in nature [click HERE for Hatten’s […]

Chart highlights on Midas, Sapphire, Sunpower, Terratech (9 Feb 17)

Dear readers, The animal spirits seem to have finally descended on our Singapore market! Our STI is one of the best performing indices with a blistering 6.4% year to date return. Our FSTS ST Small Cap Index has returned 3.8% year to date. I have highlighted four charts which (I feel) deserve attention. Do note the caveats below.   Midas With reference to my write-up on Midas dated 3 Feb 17 (click HERE), Midas’ inverse head and shoulders pattern seems to be confirmed with the decisive upside break above its 200D exponential moving average (“EMA”) and neckline of around $0.230 […]

Ernest’s market outlook (27 Jan 17)

Dear all, Happy Chinese New Year! How is your Rooster Year so far? S&P500 and STI reached near, or at my near-term resistances. What’s next?   S&P500 Just to recap what I have mentioned on 13 Jan 2017 (see HERE), I wrote “It is clear that S&P500 continues to on an uptrend amid rising EMAs. S&P500 closed at 2,275 on 13 Jan 2017. Since 8 Dec 2016, S&P500 has been consolidating between 2,238 – 2,278 and it seems to be staging an upside breakout. A sustained break above 2,278 / below 2,238 points to an eventual measured technical target 2,318 […]