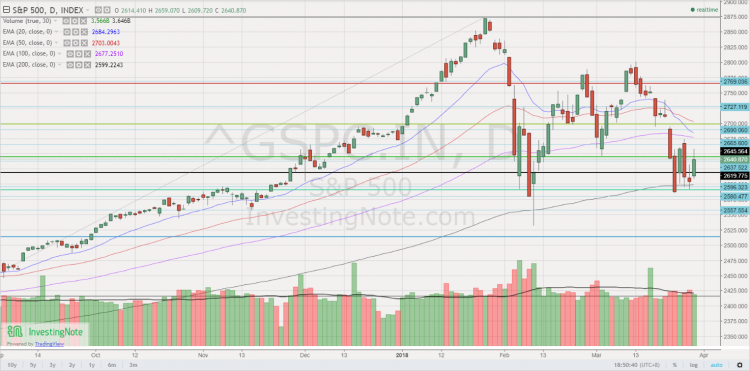
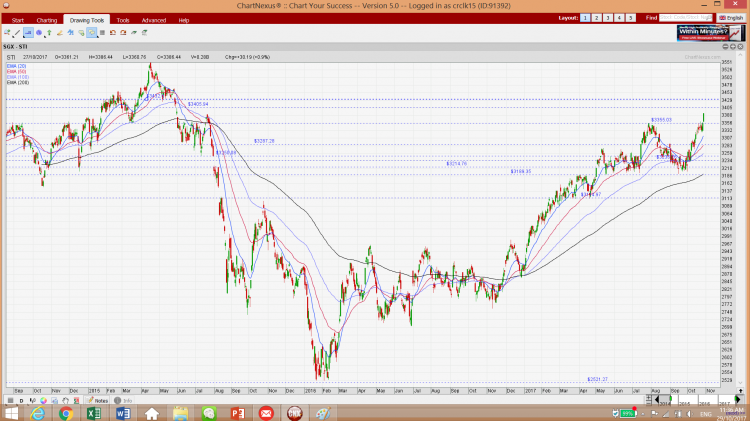
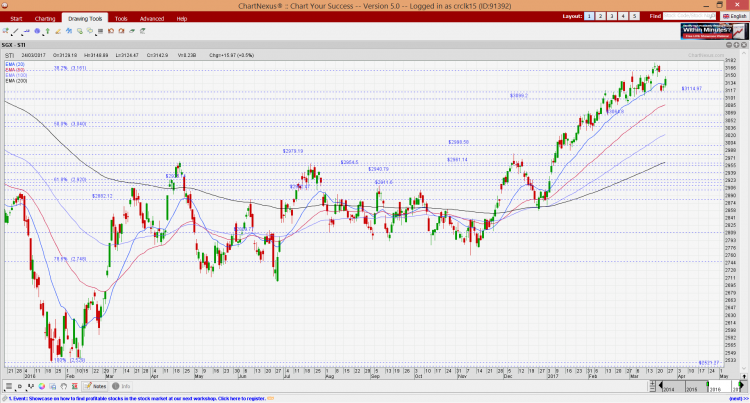
STI slumps 198 points after hitting a decade high of 3,642 on 2 May! (30 May 18)

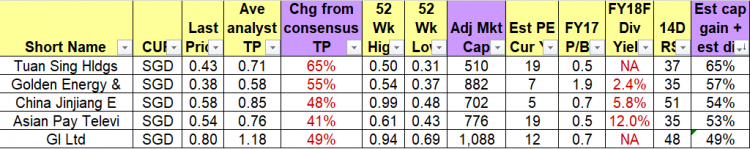
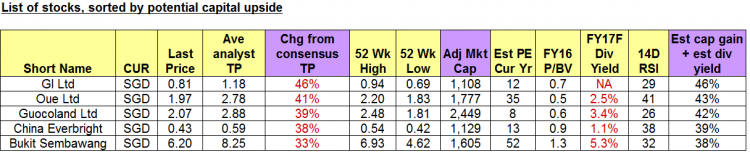
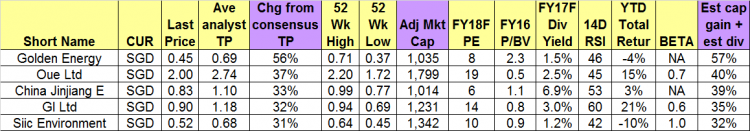
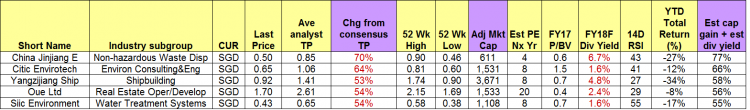
With reference to my market outlook HERE posted on 11 May 2018, I mentioned at that time that I have started to sell into strength, as I am cautious on the overall market. Clients would have been aware / notified that I have already reduced my percentage invested to <60% early last week. STI has since dropped 126 points from 3,570 on 11 May 2018 to close 3,444 on 30 May 2018. For those who wish to accumulate on weakness, I have compiled a list of stocks here, using Bloomberg’s data as of 30 May 2018. The criteria for compilation […]

Island reversal; potential Dow Theory sell signal… What does this mean for our markets? (30 Mar 18)

Dear all, Besides the headline grabbing news on Facebook and the U.S. China trade tariffs etc. some of you may have noticed other equally interesting / alarming headlines such as the island reversal chart formation seen in Nasdaq 100 (click HERE) and Nasdaq Composite index, and reports that a potential “Dow Theory” sell signal, one of the oldest and arguably the most widely followed market timing tool, may happen anytime (click HERE). What should we do? Let’s take a closer look at the charts and my personal action plan.   S&P500 closed 2,640. Day range 2,610 – 2,659 Based on […]

S&P500 – closed below its 200D EMA – a 1st since Nov 2016! (23 Mar 18)

Dear all, Previously, I mentioned in my write-up dated 21 Mar that I am avoiding the event risk of the U.S. tariff package against Chinese (click HERE). This proves timely as S&P500 fell 129 points, or 4.7% from 2,717 on 20 Mar to close 2,588 on 23 Mar. At 2,588, S&P500 has made its first close below its 200D exponential moving average (“EMA”) since Nov 2016. Why and how is this significant?  During the sharp 10% drop in the first part of Feb 2018, S&P500 has not closed below its 200D EMA. Furthermore, most technical analysts are watching this level […]

Markets – whipsawed by multiple events (20 Mar 18)

Our markets have been whipsawed by multiple events, such as rising inflation expectations and bond yields, protectionism (for e.g. Trade tariffs), upcoming FOMC meeting and sudden key personnel changes in the White House etc… How should we react or trade in current market conditions? Let’s take a look at the market events and the indices’ charts…   5 observations on the market Fed Chairman Jerome Powell’s first FOMC meeting tonight. A 25bps rate hike is almost certainly expected but markets will be scrutinising what the new Fed Chairman will be saying during the conference; Based on an article on Washington […]

S&P 500 jumped 4.3% last week, the best performance since Jan 2013! Is the recent sell off over? (18 Feb 18)

Last week, all three U.S. major indices (i.e. DOW, S&P500 and Nasdaq) have registered their best weekly performance in years. Is the recent sell off over? Let’s take a look.   7 observations on the market U.S 10Y bond yield is still relatively high at 2.875% (click HERE) vis-à-vis 2.418% a year ago. If it suddenly surges to around 3%, it may fuel another sell off; Inflation based on several indicators such as core CPI / core PPI released the week of 12 – 16 Feb are rising faster than forecasts. However, market shows limited reaction towards the inflation data […]

Global indices have tumbled 6% since their recent high. Will they go lower? (7 Feb 18)

Dear all, With reference to my earlier write-up citing that “Volatility in the market is among the lowest in 118 years…” (click HERE), I guess the old saying is still true. i.e. “Be careful of what one wishes for”, especially in the equity markets! Global indices have recently tumbled at least 6% since their recent high. Will markets fall further?   S&P500 closed at 2,682 S&P500 has swung from an intraday high of 2,873 on 26 Jan 2018 to touch an intraday low of 2,593 on 6 Feb 2018. 20D and 50D exponential moving averages (“EMAs”) are turning downwards. Other […]

Ernest’s market opinion (10 Nov 17)

Dear all STI has closed at 3,420, in line with my view that STI’s chart continues to be bullish (refer to my technical write-up on STI HERE), despite the elevated RSI.   1. Equities – still favour over bonds over 3-5 year time frame but… Personally, notwithstanding the market rally, I believe that over the long term, equities are still likely to outperform bonds and cash. Having said that, I am not telling all my clients to plough everything into stocks NOW, given that in the near term, there may not be significant catalysts to push the market higher by […]

2 companies to watch out as markets reach new highs (3 Nov 17)

Based on yesterday’s close, Nasdaq clocked a 63rd record close for 2017 and overtook the previous 62 record closes for 1980! S&P500, Nasdaq and Dow registered their 25th record close for 2017 simultaneously, matching the record established in 1995. On our local front, STI approaches a more than two year high. 2017 has not ended yet. For those investors who have not invested much, are they too late to the party? Are there still stocks with scope for potential upside? Personally, I believe that there are two companies, namely Hatten Land (“Hatten”) and GSS Energy (“GSS”) with interesting charts and […]

Ernest’s market opinion (27 Oct 17)

Dear all STI has closed at 3,386, a fresh 29-month high. Some of you who have been less than 30% invested in their portfolios and have not added more exposure in their equities portfolio last month are wondering whether you have missed out of the rally. Should you continue to chase this? Read on for more.   S&P500 last closed 2,581 S&P500 is on a strong uptrend with all the exponential moving average (“EMA”) trending higher. ADX closed at 29.3, amid positively placed DIs, indicative of a trend. RSI closed at 70.7. This is not extremely overbought, relative to past […]

Ernest’s market outlook (24 Mar 17)

Dear all, After 109 trading days, S&P500 finally staged a 1% drop on 21 Mar 2017. Is this the start of a correction? Let’s take a look at the charts.   S&P500 Just to recap what I have mentioned on 10 Mar 2017 (see HERE), I wrote “All the EMAs are rising steadily. Since 8 Nov 2016, S&P500 has not traded below its 20D EMA for more than one trading session. Amid positively placed directional indicators (“DIs”), ADX has risen from 34 on 24 Feb 2017 to 38 on 10 Mar 2017, indicative of a trend. RSI has weakened from […]