Ying Li’s chart – consolidating nicely around $0.14+, before the next up-move? (12 Dec 17)

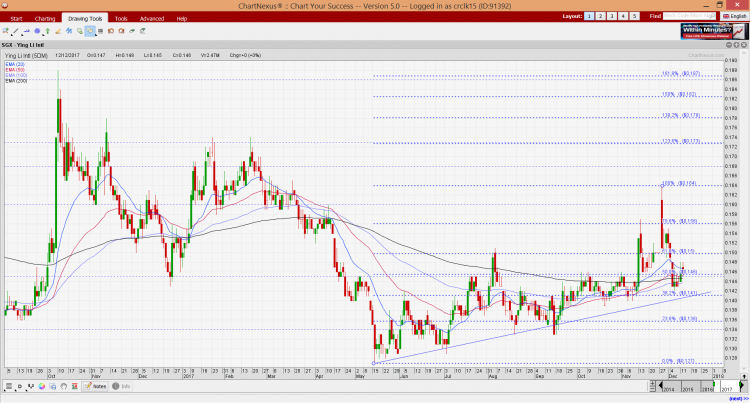
Ying Li’s chart seems to be consolidating nicely around $0.14+. Where will it go from here?   Personal chart observation With reference to Chart 1 below, Ying Li surged to an intraday high of $0.164 on 28 Nov 2017 immediately after the divestment announcement (See elaboration and announcement link below), before profit taking set in. Since then, Ying Li seems to be consolidating around $0.14+. Since 16 May 2017, Ying Li has been setting higher lows and higher highs. All the exponential moving averages (“EMAs”) have either stopped declining, or are moving higher. Although Ying Li’s share price has languished […]
2 companies to watch out as markets reach new highs (3 Nov 17)

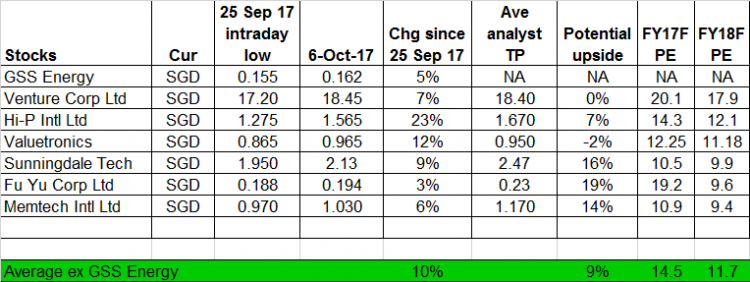
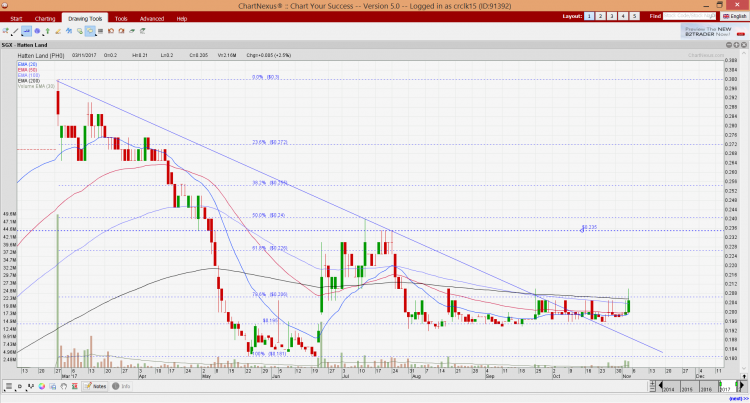
Based on yesterday’s close, Nasdaq clocked a 63rd record close for 2017 and overtook the previous 62 record closes for 1980! S&P500, Nasdaq and Dow registered their 25th record close for 2017 simultaneously, matching the record established in 1995. On our local front, STI approaches a more than two year high. 2017 has not ended yet. For those investors who have not invested much, are they too late to the party? Are there still stocks with scope for potential upside? Personally, I believe that there are two companies, namely Hatten Land (“Hatten”) and GSS Energy (“GSS”) with interesting charts and […]

GSS Energy – Personal view from technical and fundamental aspects (6 Oct 17)

In my technical write-up on GSS Energy (“GSS”) dated 14 Sep 2017 (click HERE), I highlighted the possibility that GSS may be on the verge of forming a potential inverse head and shoulder formation. For this write-up, I have put in my personal view based on both technical and fundamental aspects. Read below for more.   Technical outlook – bullish Why do I feel the chart looks positive? a) Previously, in my earlier technical write-up, I mentioned that a breach above $0.157 with volume and on a sustained basis points to an eventual measured technical target of around $0.186. GSS […]

Hatten Land – poised to breach above $0.210 (26 Sep 17)

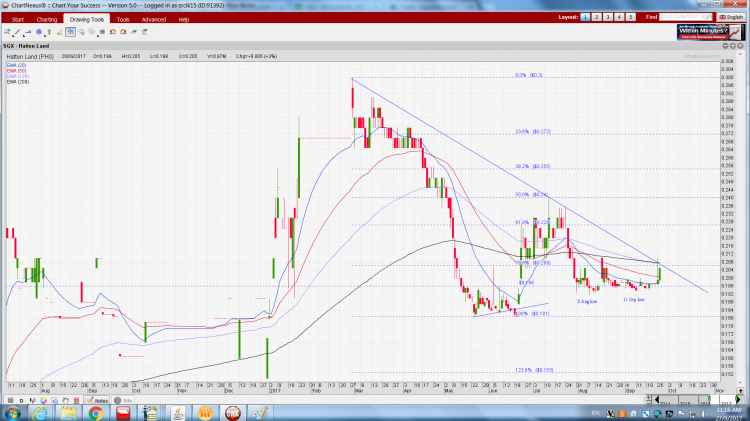
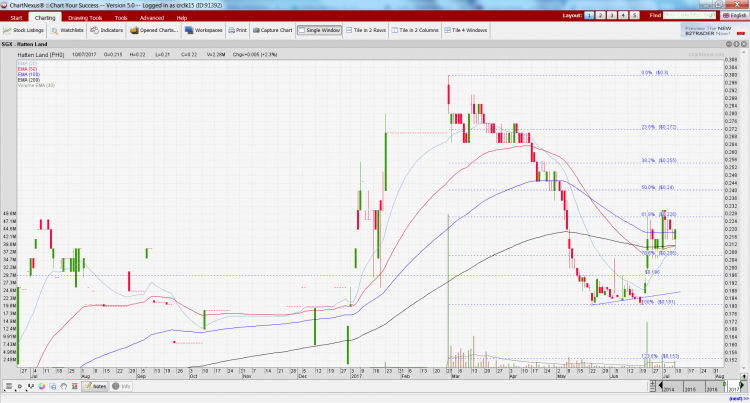
Hatten Land (“Hatten”) has been trading in a tight range $0.192 – 0.210 for the past two months. Recently, there seems to be a pick up in the volume traded for the past two days. Hatten’s chart looks positive on several fronts.   Chart analysis Based on Chart 1 below, odds seem high that Hatten may be poised to breach above $0.210 in the next couple of months. This is because a) The recent price increase (albeit mild price increase) is accompanied with volume. On the days which Hatten falls, it is accompanied with lower than average volume; b) A […]

Ernest’s market opinion (18 Aug 17)

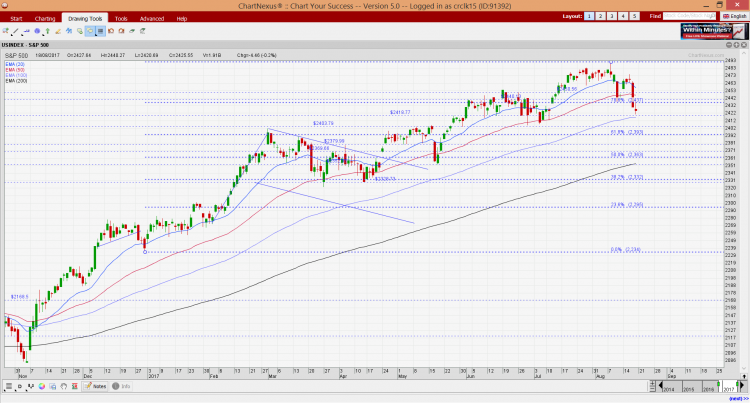
Dear all Our STI has broken a one-month trading range of around 3,288 – 3,348. Where will STI and the other indices go from here?   S&P500 last closed 2,426 Based on Chart 1 below, although 20D exponential moving average (“EMA”) is trending lower, the other EMAs, namely 50D, 100D and 200D EMA are still trending up. RSI closed at 37.2. Since 7 Nov 2016, the lowest RSI was around 35.9 on 10 Apr 2017. Although the directional indicators (“DIs”) are negatively placed, ADX is still at a low 12.2 which is indicative of a trendless market. My personal view […]

GSS Energy dived 31% since 29 Mar 17. What gives? (18 Aug 17)

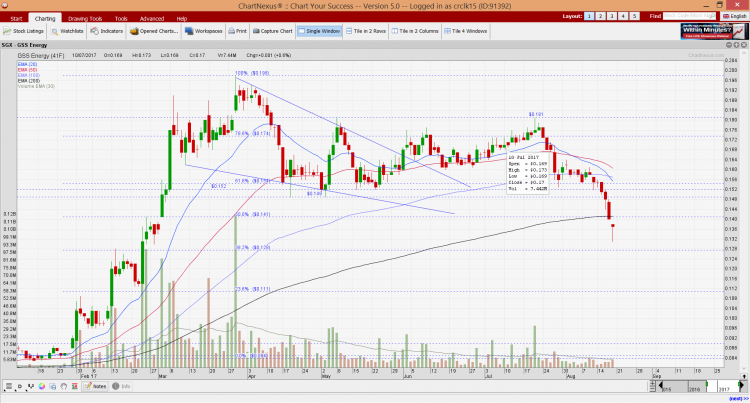
Since my write-up on GSS Energy (“GSS”) dated 28 Nov 2016 (see HERE), GSS’ share price has surged 154% from $0.078 on 28 Nov 2016 to an intraday high of $0.198 on 29 Mar 2017. It has subsequently dived 31% to close $0.137 on 18 Aug 2017. For chartists who monitor GSS, they would have noted that GSS has broken its 4-month trading range of (approximate) $0.152 – 0.181 which is a bearish development. In this write-up, I will structure it differently. To attempt to explain the price fall, I will discuss what has changed and what has not changed […]

Hatten Land – chart looks positive on several fronts! (10 Jul 17)

Pursuant to my previous write-up on 23 May 2017 (click HERE for the earlier write-up) citing the oversold nature on Hatten’s chart, Hatten has surged 20.2% from $0.183 on 23 May 2017 to close $0.220 on 10 Jul 2017. Hatten’s chart looks positive on several fronts.   Chart analysis Based on Chart 1 below, Hatten’s chart seems to have several positives. a) It is evident that the recent price increase is accompanied with volume. On the days which Hatten falls, it is accompanied with lower than average volume; b) A double bottom formation seems to have formed with the neckline breakout […]

Sapphire – 4 interesting updates which market may have ignored (2 Jun 17)

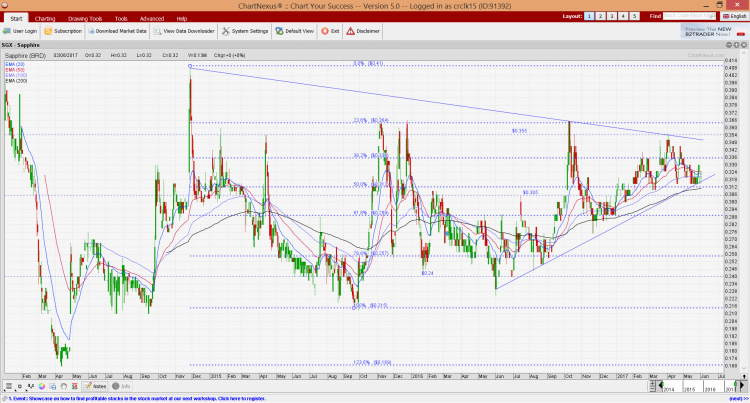
Since my last company update on Sapphire on 10 Mar 2017 (see HERE), Sapphire has unveiled other interesting updates. Although the share price did appreciate 15% from $0.310 on 10 Mar 2017 to a high of $0.355 on 3 Apr 2017, it has since slid back to $0.320 on 2 Jun 2017. What are the recent updates and why are they interesting?   Strategic collaboration with Beijing Enterprises Water and China Railway On 16 May 2017, Sapphire announced that its wholly owned infrastructure business, Ranken has entered strategic partnerships with major Chinese conglomerates and state-owned enterprises to explore civil engineering […]

Capital world has tumbled 46% since 29 Mar 17. What gives? Will it fall further? (1 Jun 17)

Capital World (formerly known as Terratech Group Limited) has slumped a whopping 46% from its intraday high of $0.240 on 29 Mar 2017 to close $0.130 on 1 Jun 2017. What has happened to cause such a massive fall? Will it fall further?   Company description Capital World is an innovative property developer that works with landowners on a joint venture basis to create value added property developments. Such joint venture requires minimal capital outlay and maximises investment returns. It is currently developing Project Capital City, an integrated property project comprising a retail mall, hotel and serviced suites and serviced […]

Chart alerts for ISOTeam and Singpost (9 May 17)

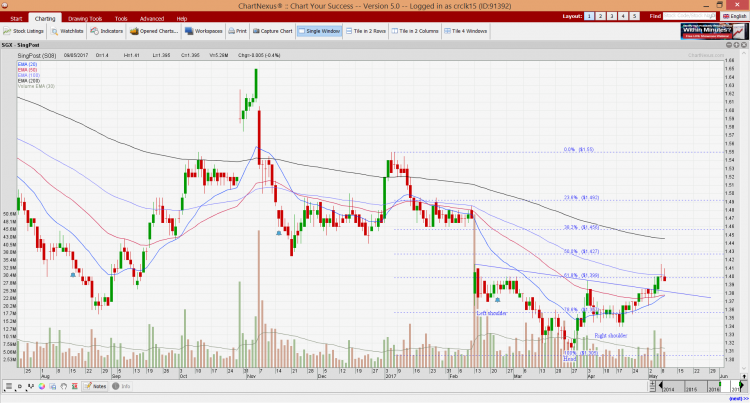
Two charts have caught my attention, one potentially bullish (Singpost) and the other one potentially bearish (ISOTeam). Below are my personal views.   1. ISOTeam – hanging near critical support Based on Chart 1 below, ISOTeam has been trading in an approximately 10 month range $0.370 – 0.430 since Jul 2016. Most exponential moving averages (“EMAs”) such as 20D, 50D and 100D are sliding and compressing. This compression is usually unsustainable over the long term and may signify a possible significant price movement. ADX closed at 24. Although the directional indicators (“DIs”) are positively placed, +DI is turning downwards quite […]