STI slumps 198 points after hitting a decade high of 3,642 on 2 May! (30 May 18)

With reference to my market outlook HERE posted on 11 May 2018, I mentioned at that time that I have started to sell into strength, as I am cautious on the overall market. Clients would have been aware / notified that I have already reduced my percentage invested to <60% early last week. STI has since dropped 126 points from 3,570 on 11 May 2018 to close 3,444 on 30 May 2018. For those who wish to accumulate on weakness, I have compiled a list of stocks here, using Bloomberg’s data as of 30 May 2018. The criteria for compilation […]

STI notched a ten year high on 2 May – is it a screaming buy for all SG stocks (11 May 18)

Dear all, Dow has logged a seventh consecutive rise and small caps as measured by S&P600 index have just closed at a record high as of 11 May 2018. Our Singapore market has also done us proud too by becoming Asia’s best performing equity market on 2 May 2018. In view of the above, is it a screaming buy for our Singapore market, especially our small caps which have under-performed? Let’s take a closer look at the charts and my personal action plan.   S&P500 closed 2,728. Day range 2,717 – 2,733 Based on Chart 1 below, S&P500 seems to […]

Venture approaches bear territory! Should we sell? (24 Apr 18)

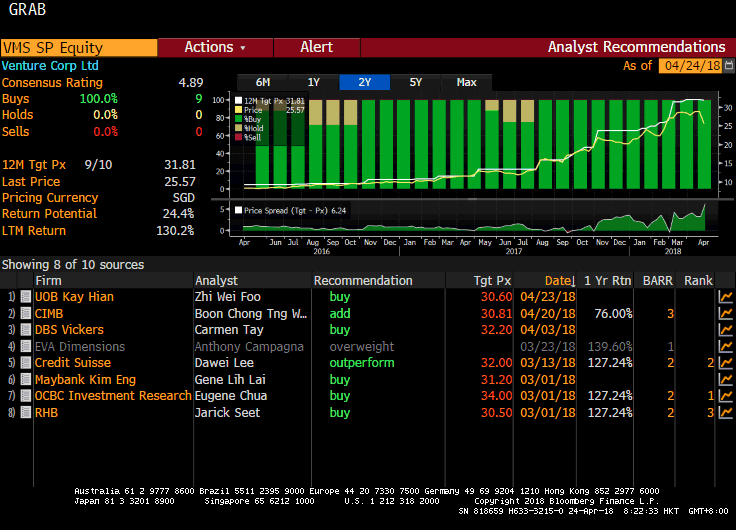
Dear all, Venture has entered into bear territory after dropping 21% from an intraday high of $29.65 on 13 Apr 2018 to close $23.40 on 24 Apr 2018. What should we do? Let’s examine the chart and some noteworthy points on Venture.   Chart analysis Based on Chart 1 below, Venture’s chart seems to resemble a bearish double top formation. The break below its neckline $26.95 points to an eventual technical measured target $24.60 which is already attained today. 20D, 50D and 100D exponential moving averages (“EMA”) have started to turn lower amid the sharp drop. Venture closed below its […]

HK listed China banks to report results this week – potential trading opportunities? (23 Mar 18)

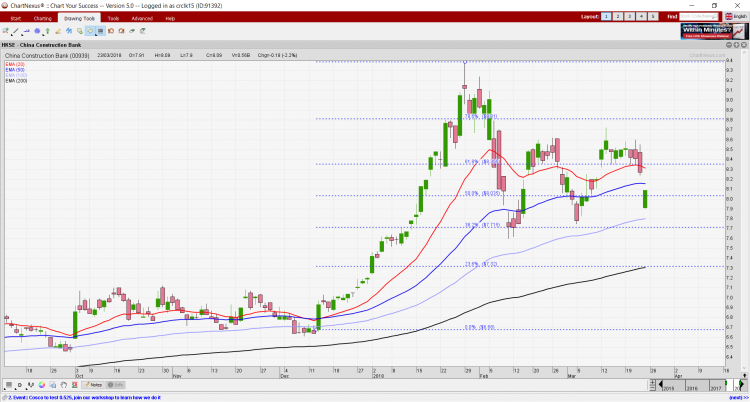
With reference to my earlier write-up (click HERE), besides SGX listed stocks, clients and readers can consider to take a look at some of the China banks listed on HK stock exchange. They may be interesting due to their upcoming results which may present some potential trading opportunities, especially when some of them have fallen 13-14% from their recent highs on 29 Jan 2018.   Why do I choose HK listed China banks, instead of our local banks for potential trading opportunities? 1. On a macro picture, Hang Seng seems to be slightly stronger than STI based on chart. For […]

S&P500 – closed below its 200D EMA – a 1st since Nov 2016! (23 Mar 18)

Dear all, Previously, I mentioned in my write-up dated 21 Mar that I am avoiding the event risk of the U.S. tariff package against Chinese (click HERE). This proves timely as S&P500 fell 129 points, or 4.7% from 2,717 on 20 Mar to close 2,588 on 23 Mar. At 2,588, S&P500 has made its first close below its 200D exponential moving average (“EMA”) since Nov 2016. Why and how is this significant?  During the sharp 10% drop in the first part of Feb 2018, S&P500 has not closed below its 200D EMA. Furthermore, most technical analysts are watching this level […]

Ying Li’s chart – consolidating nicely around $0.14+, before the next up-move? (12 Dec 17)

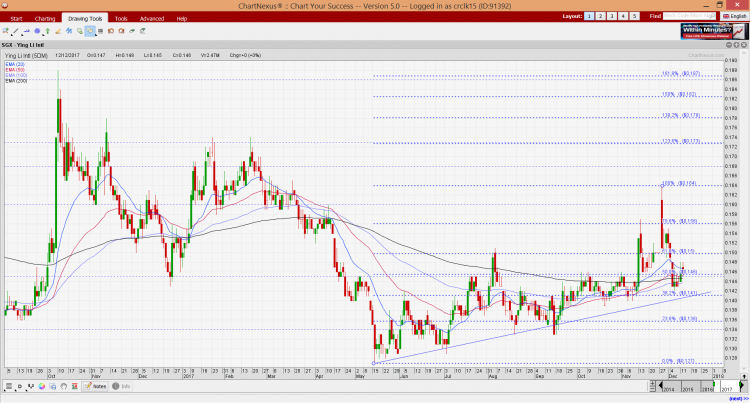
Ying Li’s chart seems to be consolidating nicely around $0.14+. Where will it go from here?   Personal chart observation With reference to Chart 1 below, Ying Li surged to an intraday high of $0.164 on 28 Nov 2017 immediately after the divestment announcement (See elaboration and announcement link below), before profit taking set in. Since then, Ying Li seems to be consolidating around $0.14+. Since 16 May 2017, Ying Li has been setting higher lows and higher highs. All the exponential moving averages (“EMAs”) have either stopped declining, or are moving higher. Although Ying Li’s share price has languished […]

Sapphire – 4 interesting updates which market may have ignored (2 Jun 17)

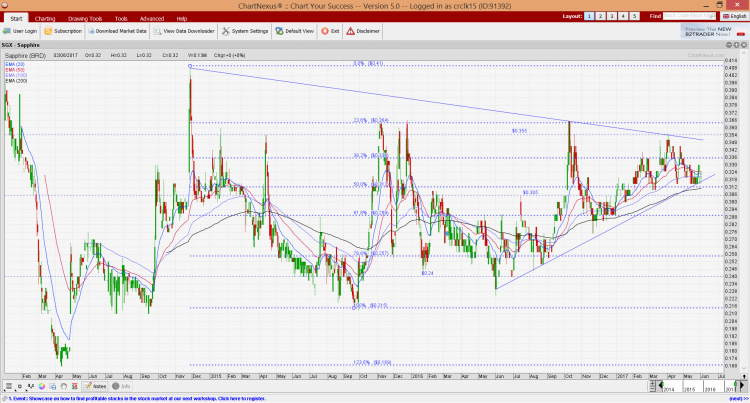
Since my last company update on Sapphire on 10 Mar 2017 (see HERE), Sapphire has unveiled other interesting updates. Although the share price did appreciate 15% from $0.310 on 10 Mar 2017 to a high of $0.355 on 3 Apr 2017, it has since slid back to $0.320 on 2 Jun 2017. What are the recent updates and why are they interesting?   Strategic collaboration with Beijing Enterprises Water and China Railway On 16 May 2017, Sapphire announced that its wholly owned infrastructure business, Ranken has entered strategic partnerships with major Chinese conglomerates and state-owned enterprises to explore civil engineering […]

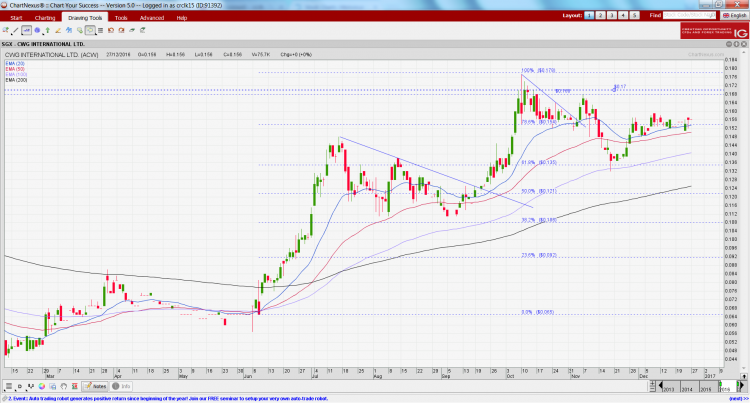
CWG chart looks strong, despite price consolidation (27 Dec 16)

CWG International Limited (“CWG”), former Chiwayland, closed unchanged at $0.156 on 27 Dec 16. Based on Chart 1 below, notwithstanding the recent price consolidation, all its exponential moving averages (“EMAs”) are still rising strongly, indicative of an uptrend. OBV is at elevated levels despite the price consolidation (i.e bullish). Amid positively place directional indicators, ADX is around 25, indicative of a trend. RSI closed at 56. Although the usual benchmark for RSI’s overbought level is around 70, it is noteworthy based on historical records, its RSI can reach 90 before profit taking occurs. All in, the chart looks positive. A […]